
UNITED STATES
SECURITIES AND EXCHANGE COMMISSION
Washington, D.C. 20549
FORM
ANNUAL REPORT PURSUANT TO SECTION 13 OR 15(d) OF THE SECURITIES EXCHANGE ACT OF 1934 |
For the fiscal year ended
OR
TRANSITION REPORT PURSUANT TO SECTION 13 OR 15(d) OF THE SECURITIES EXCHANGE ACT OF 1934 FOR THE TRANSITION PERIOD FROM TO |
Commission File Number
(Exact name of Registrant as specified in its Charter)
(State or other jurisdiction of incorporation or organization) |
(I.R.S. Employer Identification No.) |
(Address of principal executive offices) |
(Zip Code) |
Registrant’s telephone number, including area code: (
Securities registered pursuant to Section 12(b) of the Act:
|
|
Trading |
|
|
|
|
Securities registered pursuant to Section 12(g) of the Act: None
Indicate by check mark if the Registrant is a well-known seasoned issuer, as defined in Rule 405 of the Securities Act. YES ☐
Indicate by check mark if the Registrant is not required to file reports pursuant to Section 13 or 15(d) of the Act. YES ☐
Indicate by check mark whether the Registrant: (1) has filed all reports required to be filed by Section 13 or 15(d) of the Securities Exchange Act of 1934 during the preceding 12 months (or for such shorter period that the Registrant was required to file such reports), and (2) has been subject to such filing requirements for the past 90 days.
Indicate by check mark whether the Registrant has submitted electronically every Interactive Data File required to be submitted pursuant to Rule 405 of Regulation S-T (§232.405 of this chapter) during the preceding 12 months (or for such shorter period that the Registrant was required to submit such files).
Indicate by check mark whether the registrant is a large accelerated filer, an accelerated filer, a non-accelerated filer, smaller reporting company, or an emerging growth company. See the definitions of “large accelerated filer,” “accelerated filer,” “smaller reporting company,” and “emerging growth company” in Rule 12b-2 of the Exchange Act.
|
☒ |
|
Accelerated filer |
|
☐ |
|
Non-Accelerated filer |
|
☐ |
|
Smaller reporting company |
|
|
Emerging growth company |
|
|
|
|
|
If an emerging growth company, indicate by check mark if the registrant has elected not to use the extended transition period for complying with any new or revised financial accounting standards provided pursuant to Section 13(a) of the Exchange Act. ☐
Indicate by check mark whether the registrant has filed a report on and attestation to its management’s assessment of the effectiveness of its internal control over financial reporting under Section 404(b) of the Sarbanes-Oxley Act (15 U.S.C. 7262(b)) by the registered public accounting firm that prepared or issued its audit report.
If securities are registered pursuant to Section 12(b) of the Act, indicate by check mark whether the financial statements of the registrant included in the filing reflect the correction of an error to previously issued financial statements.
Indicate by check mark whether any of those error corrections are restatements that required a recovery analysis of incentive-based compensation received by any of the registrant’s executive officers during the relevant recovery period pursuant to §240.10D-1(b). ☐
Indicate by check mark whether the Registrant is a shell company (as defined in Rule 12b-2 of the Exchange Act). YES ☐ NO
The aggregate market value of Common Shares held by non-affiliates as of September 30, 2023, was $
The number of shares of Registrant’s Common Stock outstanding as of May 17, 2024 was
DOCUMENTS INCORPORATED BY REFERENCE
Portions of the registrant's definitive Proxy Statement to be used in connection with its 2024 Annual Meeting of Shareholders will be incorporated by reference into Part III of this Annual Report on Form 10-K. Such Proxy Statement, or an amendment to this Report, will be filed with the Securities and Exchange Commission within 120 days after the end of the fiscal year to which this Report relates.
AGILYSYS, INC.
Annual Report on Form 10-K
Year Ended March 31, 2024
Table of Contents
|
|
Page |
|
4 |
|
|
|
|
ITEM 1. |
4 |
|
ITEM 1A. |
14 |
|
ITEM 1B. |
24 |
|
ITEM 1C. |
24 |
|
ITEM 2. |
25 |
|
ITEM 3. |
25 |
|
ITEM 4. |
25 |
|
ITEM 4A. |
26 |
|
|
|
|
|
27 |
|
|
|
|
ITEM 5. |
27 |
|
ITEM 6. |
28 |
|
ITEM 7. |
Management’s Discussion and Analysis of Financial Condition and Results of Operations |
29 |
ITEM 7A. |
40 |
|
ITEM 8. |
41 |
|
ITEM 9. |
Changes in and Disagreements with Accountants on Accounting and Financial Disclosure |
68 |
ITEM 9A. |
68 |
|
ITEM 9B. |
68 |
|
ITEM 9C. |
Disclosure Regarding Foreign Jurisdictions that Prevent Inspections |
69 |
|
|
|
|
70 |
|
|
|
|
ITEM 10. |
70 |
|
ITEM 11. |
70 |
|
ITEM 12. |
Security Ownership of Certain Beneficial Owners and Management and Related Shareholder Matters |
70 |
ITEM 13. |
Certain Relationships and Related Transactions, and Director Independence |
70 |
ITEM 14. |
70 |
|
|
|
|
|
71 |
|
|
|
|
ITEM 15. |
71 |
|
|
|
|
|
74 |
|
2
Forward Looking Information
This Annual Report and other publicly available documents, including the documents incorporated herein and therein by reference, contain, and our officers and representatives may from time to time make, “forward-looking statements” within the meaning of the safe harbor provisions of the U.S. Private Securities Litigation Reform Act of 1995. These statements include, but are not limited to, statements related to our current expectations, the performance of our business, our financial results, our liquidity and capital resources and other non-historical statements. Forward-looking statements can be identified by words such as: “anticipate,” “intend,” “plan,” “goal,” “seek,” “believe,” “project,” “estimate,” “expect,” “strategy,” “future,” “likely,” “may,” “should,” “will” and similar references to future periods. Forward-looking statements are neither historical facts nor assurances of future performance. Instead, they are based only on our current beliefs, expectations and assumptions regarding the future of our business, future plans and strategies, projections, anticipated events and trends, the economy and other future conditions. Because forward-looking statements relate to the future, they are subject to inherent uncertainties, risks and changes in circumstances that are difficult to predict, and in many cases, are outside of our control. Our actual results and financial condition may differ materially from those indicated in the forward-looking statements. Therefore, you should not rely on any of these forward-looking statements. Important factors that could cause our actual results and financial condition to differ materially from those indicated in the forward-looking statements include, among others, our ability to achieve operational efficiencies and meet customer demand for products and services as well as the other risks identified in the risk factors set forth in Item 1A of this Annual Report. Any forward-looking statement made by us in this Annual Report is based only on information currently available to us and speaks only as of the date on which it is made. We undertake no obligation to publicly update any forward-looking statement made in this Annual Report or any other forward-looking statement that may be made from time to time, whether written or oral, whether as a result of new information, future events, or otherwise.
3
Part I
Item 1. Business.
Overview
Agilysys has been a leader in hospitality software for more than 45 years, delivering innovative cloud-native SaaS and on-premise solutions for hotels, resorts and cruise lines, casinos, corporate foodservice management, restaurants, universities, stadiums, and healthcare. The Company’s software solutions include point-of-sale (POS), property management (PMS), inventory and procurement, payments, and related applications that manage and enhance the entire guest journey. Agilysys also is known for its world-class customer-centric service. Many of the top hospitality companies around the world use Agilysys solutions to improve guest loyalty, drive revenue growth, and increase operational efficiencies. Agilysys operates across North America, Europe, the Middle East, Asia-Pacific, and India, with headquarters in Alpharetta, GA.
The Company has just one reportable segment serving the global hospitality industry.
Our principal executive offices are located at 3655 Brookside Parkway, Suite 300, Alpharetta, Georgia, 30022.
Reference herein to any particular year or quarter refers to periods within our fiscal year ended March 31. For example, fiscal 2024 refers to the fiscal year ended March 31, 2024.
History and Significant Events
Organized in 1963 as Pioneer-Standard Electronics, Inc., an Ohio corporation, we began operations as a distributor of electronic components and, later, enterprise computer solutions. Exiting the former business in fiscal 2003 with the sale of our Industrial Electronic Division, we used the proceeds to reduce debt and fund growth of our enterprise solutions business. This included acquiring businesses focused on higher-margin and more specialized solutions for the hospitality and retail industries. At the same time, we changed our name to Agilysys, Inc.
In fiscal 2004, we acquired Inter-American Data, Inc., which allowed us to become the leading developer and provider of technology solutions for hotel property management and inventory management in the casino and resort industries.
In fiscal 2007, we exited the enterprise computer distribution business. We used the proceeds from that sale to return cash to shareholders and fund a number of acquisitions that broadened our solutions and capabilities portfolios. We acquired InfoGenesis, Inc., Visual One Systems Corp. and Eatec Corporation in fiscal 2008, significantly expanding our specialized offerings to the hospitality industry through enterprise-class POS, PMS and inventory and procurement software solutions tailored for a variety of applications in cruise, golf, spa, gaming, lodging, resort and catering. These offerings feature highly intuitive, secure and robust solutions, easily scalable across multiple departments or property locations.
In fiscal 2012, we sold our IT solutions business and restructured our business model to focus on higher-margin, profitable growth opportunities in the hospitality and retail sectors. We also reduced our real-estate footprint and lowered overhead costs by relocating corporate services from Solon, Ohio to Alpharetta, Georgia, thus moving our senior management team closer to our remaining operating units.
In fiscal 2014, we sold our retail solutions and services business to Kyrus Solutions, Inc. (Kyrus), an affiliate of Clearlake Capital Group, L.P. Following completion of the transaction, our business focused exclusively on hospitality solutions and the growth opportunities in the hospitality market.
In fiscal 2018, we opened a software development center in Chennai, India, to supplement our product development efforts.
We converted to a Delaware corporation in February 2022.
Today, we are focused on providing state-of-the-art, end-to-end solutions that enhance guest and staff experiences and allow our customers to promote their brands. We help our customers win the guest recruitment battle and, in turn, grow revenue, reduce costs and increase efficiency. This is accomplished by developing and deploying innovative solutions that increase data speed and accuracy, integrate with other enterprise systems and create a common infrastructure for managing guest data thereby enabling more effective management, intelligent upselling, reduced shrinkage, improved brand recognition and better control of the guest relationship.
4
Our strategy is to increase the proportion of revenue we derive from subscription services, cloud applications, ongoing support and maintenance agreements, and professional services.
Products, Support and Professional Services
We are a leading developer and marketer of software-enabled solutions and services to the hospitality industry, including software solutions fully integrated with third party hardware and operating systems; subscription and maintenance; and professional services. Areas of specialization are point of sale, property management, and a broad range of solutions that support the ecosystem of these core solutions.
We present revenue and costs of goods sold in three categories:
Total revenue for these three specific areas is as follows:
|
|
Year ended March 31, |
|
|||||||||
(In thousands) |
|
2024 |
|
|
2023 |
|
|
2022 |
|
|||
Products |
|
$ |
49,083 |
|
|
$ |
43,638 |
|
|
$ |
35,956 |
|
Subscription and maintenance |
|
|
138,069 |
|
|
|
118,285 |
|
|
|
98,958 |
|
Professional services |
|
|
50,312 |
|
|
|
36,142 |
|
|
|
27,722 |
|
Total |
|
$ |
237,464 |
|
|
$ |
198,065 |
|
|
$ |
162,636 |
|
Products: Products revenue is comprised of revenue from the sale of software along with third party hardware and operating systems. Software sales include up front revenue for licensing our solutions on a perpetual basis. Software sales are driven by our solutions’ ability to help customers meet the demands of their guests and improve operating efficiencies. Our software revenue is also driven by the ability of our customers to configure our solutions for their specific needs and the robust catalog of integrations we offer to third party solutions. Our software solutions require varying form factors of third party hardware and operating systems to operate, such as staff facing terminals, kiosk solutions, mobile tablets or servers. Third party hardware and operating system revenue is typically driven by new customer wins and existing customer hardware refresh purchases.
Subscription and Maintenance: Software subscription and maintenance services are a significant portion of our consolidated revenue and typically generate higher profit margins than products revenue. Growth has been driven by a strategic focus on developing and promoting end-to-end solutions while market demand for innovative new products addressing specific hospitality needs continues to reinforce this trend. Our commitment to exceptional service has enabled us to become a trusted partner with customers who wish to optimize the level of service they provide to their guests and maximize commerce opportunities both on premise and in the cloud.
Professional Services: We have industry-leading expertise in designing, implementing, integrating and installing customized solutions into both traditional and newly created platforms. For existing enterprises, we seamlessly integrate new systems and for start-ups and fast-growing customers, we become a partner that can manage large-scale rollouts and tight construction schedules. Our extensive experience ranges from staging equipment to phased rollouts as well as training staff to provide operational expertise to help achieve maximum effectiveness and efficiencies in a manner that saves our customers time and money.
Our portfolio of hospitality software solutions:
The hospitality industry has long been focused on operating end-to-end businesses, but the technology vendors that service the industry have been focused on product-centric solutions that make use of a high number of software modules and operating silos. To resolve this disconnect and more effectively align with the business operations of our customers, we have evolved our approach to be focused on delivering integrated “ecosystem cloud” solutions for Hospitality & Leisure, Food & Beverage and Inventory & Procurement functions through the Agilysys Hospitality Experience Cloud.
The Company delivers modular and integrated software solutions and expertise to businesses seeking to maximize Return on Experience (ROE) through hospitality encounters that are both personal and profitable. Over time, customers achieve High Return Hospitality by consistently delighting guests, retaining staff and growing margins. The Agilysys Hospitality Experience Cloud™ offers solution ecosystems that combine core operational systems for property management (PMS), point-of-sale (POS) and Inventory and Procurement (I&P) with Experience Enhancers™ that meaningfully improve interactions for guests and for employees across
5
dimensions such as digital access, mobile convenience, self-service control, personal choice, payment options, service coverage and real-time insights to improve decisions. Core solutions and Experience Enhancers are selectively combined in Hospitality Solution Studios™ tailored to specific hospitality settings and business needs.
Our integrated yet modular products allow hospitality operators to recruit and delight customers at their facilities, increase their wallet share from each guest, retain valuable staff and improve the overall experience throughout the entire guest journey – from the initial customer touch point through post-visit interactions.
With our omni-channel suite of software products, we are uniquely positioned to offer solutions that allow customers to offer contactless solutions at every point of the guest journey, and maximize operational efficiency all while providing an improved guest experience.
Food & Beverage (F&B) Ecosystem Solutions:
Agilysys Food & Beverage Ecosystem solutions allow customers to provide their guests with an omni-channel experience within their property. Guests are empowered to create their own experiences through ordering from a mobile device or walking up to a self-service kiosk, but also providing for a more traditional experience with staff by interacting with a cashier or bar, or having a server come to them. Irrespective of the channel of interaction for the guest, our POS suite provides a single integrated enterprise-grade back-office management system with robust reporting capabilities. This allows our customers to manage menus, price changes, purchasing trends, inventory management and sales reporting from a single integrated source providing for increased efficiency as well as providing a richer guest profile.
Agilysys InfoGenesis® POS is a core F&B solution. An award-winning point of sale solution that combines a fast, intuitive and highly customizable terminal application with powerful, flexible reporting and configuration capabilities in the back office management portal. The system is easy to set up, and its scalable architecture enables customers to add workstations without having to build out expensive infrastructure. InfoGenesis supports a wide range of POS devices from traditional POS terminals to iPads, Android tablets and mobile phones, allowing customers to seamlessly deploy a mix of POS experiences based upon guest and server requirements. The system’s detailed and high-quality reporting capabilities provide insight into sales data and guest purchasing trends. Engineered for all regions of the world, the InfoGenesis POS solution suite offers a multinational set of features, including language, currency and local fiscal reporting, coupled with a robust enterprise management capability enabling the largest global customers to efficiently run their businesses. With a foundation platform of modern integration APIs, the solution is also capable of integrating with a variety of ancillary applications allowing our customers to keep their entire technology estate. InfoGenesis POS is available as a cloud-based or on-premise solution.

Agilysys IG Kiosk is a core F&B solution. An enterprise-class self-service, customer-facing kiosk point of sale solution for the hospitality industry. It is ideal for food & beverage venues such as buffets, grab ‘n go, corporate cafeterias and food courts. Its flexibility supports a variety of operational workflows, such as “order and pay”, “order only”, “pay at cashier” and “self-check-out,” and integrates with a variety of property management, casino management and loyalty systems. IG Kiosk is currently deployed at more than 270 customer sites across the country, including corporate cafeterias at a top five U.S. bank, a top 40 U.S. law firm, one of the nation’s largest technology manufacturers, and at a national financial services firm.
Agilysys IG Kiosk’s intuitive guest-facing order and pay experiences transfer the control and convenience to the end user. The self-service components reduce on-site labor needed to manage venue operations, while improving guest throughput, check size, order accuracy, guest experience and satisfaction. The platform-driven and cloud-based solution allows for easy deployments and management at scale resulting in a lowered overall cost of ownership.
6
Food & Beverage Experience Enhancer Solutions:

Agilysys IG Flex is a mobility solution that offers full point of sale functionality on a Windows tablet in 6”, 8”, or 10” form factors. It provides a sleek, modern alternative to traditional point of sale installations and can be used as a slim fixed terminal or as a convertible mobile POS simply by removing the tablet from its base.

Agilysys IG KDS is a digital kitchen management solution that integrates with InfoGenesis, IG Buy® Kiosk and IG OnDemand to deliver staff and customer-originated orders to the kitchen for preparation. Custom attributes such as guest phone number, name, guest location or packaging instructions can be provided on each incoming order so the order can be fulfilled promptly to guests. Guests can optionally be notified of order completion via an order status monitor (OSM) or via text message.

Agilysys IG OnDemand provides a visual, interactive food and beverage ordering experience to any mobile device – phone, tablet, laptop – with a browser-based self-service experience. Using a simple, intuitive interface, guests can easily order and reorder from anywhere across the property, driving order velocity and volume. It also can meet the need for a tableside order and pay experience. It supports ordering for multiple guests at a table over the course of a meal using their own devices making the ordering process touchless while freeing up staff to spend more time with guests.
Agilysys IG OnDemand allows our customers to immediately offer an online ordering platform that is natively integrated with their physical location operations. Menus and price updates can be done in one place and automatically updated across all channels – online web store, digital menus and app ordering as well as POS terminals. Orders placed online are routed automatically to the appropriate kitchen for preparation. Orders placed from all channels are automatically available on the POS terminal at the physical location.

Agilysys IG Fly is a mobile handheld all-in-one POS solution that empowers staff to do it all on one device: table-side, pool-side, popup-side, wherever-side, keeping guests happy and servers hustling. It allows properties to boost guest spending with sleek handheld devices that facilitate order placement and payment acceptance without servers ever leaving guests. Servers are readily available to satisfy each guest’s immediate requests while providing faster service.

Agilysys IG Quick Pay allows guests to use their own mobile device, scan a QR code on the InfoGenesis check, review a digital copy of the check, add a tip & initiate payment, maintaining a fully touchless guest payment experience. The product can be sold as a standalone payment solution or can be bundled with IG OnDemand for a complete order and pay experience.

Agilysys IG Smart Menu provides a touchless menu display on a guest’s own mobile device - phone, tablet, laptop. Simply scan a QR code to access a venue menu that is linked directly to the actual items available in the IG OnDemand system, not a pdf or a website link. The product can be sold as a standalone menu solution or can be bundled with IG OnDemand for a complete menu, order and pay experience.

Agilysys IG Digital Menu Board provides large screen menu and image display on commercial television monitors. It will display a venue menu that is linked directly to the actual items available in the IG OnDemand system, not a pdf or a website link, so it can easily reflect the latest items and pricing.
7

IG PanOptic AI-powered self-checkout kiosk allows guests to place multiple food items on the kiosk tray all at one time where our AI service uses computer vision & AI to scan the items, recognize them and add them to the cart.

Agilysys Pay payment processing solution is our innovative payment gateway. Agilysys Pay protects guests’ financial data and reduces risk by leveraging point-to-point encryption (P2PE) and tokenization with every credit card transaction. Agilysys Pay Complete leverages one of the first payment gateways in the world to receive official PCI-P2PE validation, allowing us to offer PCI cost and scope reduction that other providers cannot. These security benefits are built on top of a full-featured, enterprise-grade gateway that offers broad support for U.S., Canadian, European and certain Asian countries’ credit card processors and a wide variety of payment device options for every use-case, including countertop, pay-at-table, EMV, mobile tablet, and signature capture scenarios.
Agilysys Pay offers contactless payment options on all markets as well as supporting various wallet payment options like Apple Pay®, Google Pay®, AliPay®, and WeChat®.

Agilysys eCash offers guests the convenience of cashless tender. Create charge accounts for memberships, employees, students, comps or any other type of charge you define. A central database supports an efficient eCash transaction process for all your accounts. An array of fields and extra settings make managing eCash accounts seamless.

A flexible easy to use solution to create and manage Gift Cards from adding balances to cards, to checking balances, and enabling guests to use them for purchases across outlets on the property.

Agilysys Analyze is a cloud-based data analytic platform focused on the needs of the hospitality industry. It is a full business intelligence solution that collects data from Agilysys point of sale and property management solutions and helps food & beverage and property operators gain critical insight into business operations and performance. Out-of-the-box analysis helps hospitality operators manage costs, minimize loss due to fraud, boost item sales, increase server productivity, occupancy, room revenue, and other profit enhancing capabilities.
Hospitality & Leisure (H&L) Ecosystem Solutions:
Agilysys offers the most comprehensive suite of hospitality & leisure applications to serve the needs of our integrated resort and hospitality customers. Our solutions enable our customers to provide a seamless experience to their guests while driving operational efficiencies throughout the value chain. Our H&L suite of applications consists of the core property management system (PMS), and experience enhancers including a commission-free booking engine, self-service check in and check out solutions, spa, golf, retail, sales & catering, service request optimization and residence management applications.

Agilysys LMS™ is a core H&L solution. An on-premise or hosted, web and mobile-enabled, PMS solution targeting the operator with large, complex operations. It runs 24/7 to automate every aspect of hotel operations in properties from 100 to over 7,000 rooms, and has interfaces to a wide array of industry applications including but not limited to all core casino management systems and leading global distribution systems. Its foundation expands to incorporate modules for activities scheduling, attraction ticketing and more.
8

Agilysys Versa PMS is a core H&L solution. It is installed in hotels and resorts ranging from 50-1,500 rooms. It is a complete hospitality solution expanding beyond traditional PMS solutions enabling the resort to run its end-to-end operations, including front desk, housekeeping, maintenance, accounting, and condo owner management, with tight integration to Agilysys Sales & Catering, Spa, Golf, and Activities. Versa provides an integrated solution with interfaces to leading global distribution systems, casino management systems, hospitality automation and our other products.

Agilysys Stay PMS is a core H&L solution. It is the company’s cloud-native SaaS property management system that optimizes operational efficiency, increases revenue and enhances guest service. Agilysys Stay is currently generally available for all hotels and chains, as well as for select service casino hotels. The guest-centric PMS leverages an open architecture with restful APIs to enable richly integrated applications delivered from Agilysys, its partners and customers. Agilysys Stay offers powerful capabilities for multi-property operations, allowing managers to view guest profiles, history and reservations, as well as room availability and operational reports, seamlessly across multiple properties.
Focused on improving revenue and streamlining operations, Agilysys Stay is designed to enable hotels to gather and analyze guest information across properties that can be used to create loyalty-generating offers and increase guest wallet share. In addition, running natively in a browser on both desktop and tablet devices, it delivers real-time operating metrics so that hotels can more accurately forecast demand and scale guest services accordingly.
Hospitality & Leisure (H&L) Experience Enhancer Solutions:

Agilysys Book is a commission-free, easy-to-use reservation system that’s designed to move guests effortlessly through the booking process of hotel rooms, spa appointments and golf tee times for a single guest itinerary. The solution allows booking of one or more rooms and is seamlessly connected with our core PMS solutions to provide a flawless experience for guests and hotel operators. Agilysys Book is the only booking engine in the market that seamlessly integrates with the core primary gaming system and allows for casino operators to enable their patrons to self-book their entitlements resulting in increased guest satisfaction and reduced operational expenses. The solution also allows operators to capture increased revenue through add-ons and upsells of premium rooms.

Agilysys Express Kiosk simplifies check-in and check-out, optimizes staff productivity and enhances the guest experience by enabling a seamless self-service option for guests to use in the hotel lobby at a kiosk. More properties are turning to kiosks to reduce overhead and offer more self-service options. With Agilysys Express - Kiosk, it’s easy to elevate service levels without adding front-line staff. Agilysys Express - Kiosk provides ID verification to allow for hotels to enforce security standards efficiently and to allow the guest to bypass the front desk and observe social distancing guidelines.

Agilysys Express Mobile simplifies check-in and check-out even further and at the same time allows operators to offer mobile keys, concurrent dining reservations or room upsells, all on a personal mobile device such as a smart phone or tablet. Properties are turning to mobility at an ever-increasing pace to improve efficiency. With Agilysys Express - Mobile, it’s easy to reduce wait times and empower guests by putting the power of choice in the palm of their hand. Agilysys - Express Mobile allows for digital ID verification before securely delivering the digital room key to the guest phone allowing operators to maintain security standards while allowing the guest to bypass the front desk.
9

Agilysys Spa software covers all aspects of running a spa, from scheduling guests for services to managing staff schedules. With this guest-centric technology, spas have more time to focus on creating personalized experiences in places of quiet tranquility. Agilysys Spa is a single solution that connects effortlessly to our other software solutions. The solution includes real-time integration, simplifies the appointment booking process, enhances the guest experience, and maximizes the value of the spa as a revenue center.
Integrated with our booking engine, Agilysys Book, customers can book both their hotel room and their spa appointments from a single place giving operators additional opportunities to upsell and cross sell various amenities that they can offer.

Agilysys Golf is a guest centric golf management software that offers golf property managers complete pro shop management with tee time scheduling, member profile/billing, tournament management and Web and e-mail access bundled into one solution. Customers are given the option of using our robust built in retail POS module or they may choose to leverage the power of InfoGenesis. Staff can easily schedule and personalize reservations for guests which then appear on itineraries, confirmations, and folios. Resort operations with multiple amenities can integrate with Agilysys Book and allow patrons to book both their resort reservation and their golf tee time simultaneously.

Agilysys Sales & Catering provides a cloud-native comprehensive sales & event management system that provides powerful tools for hotels, conference centers and resorts of all sizes. With a complete view of every group and event, as well as guests throughout their entire stay, the system fully exposes the value of each guest and group across meeting and shoulder dates. The result is improved event revenue opportunities and streamlined management enabling event planners and sales teams to more efficiently sell, manage and service their clients.

Agilysys Service is our integrated service optimization platform that allows our customers to provide an integrated hospitality experience for their guests while driving greater operational efficiency by connecting departments across the hotel – front desk, house-keeping, concierge, maintenance, bell desk, food runners, wait staff, etc. The Agilysys service platform provides a unified communication and messaging service for guest and staff interaction as well as internal staff interaction. Apart from providing the functionality for managing back of house operations like house-keeping, engineering and maintenance, the Agilysys service platform proactively tracks events and exceptions that take place in the hotel or resort and drive targeted action to ensure high level of guest satisfaction at all times.

Agilysys Authorize provides support for fully-automated and secure online payments for any room deposits, 3rd party guarantees and folio charges - while eliminating the need for manual credit card authorization forms. Payment is seamlessly authorized and posted appropriately in real-time.

Agilysys DataMagine™ document management solution is a U.S.-patented imaging module and archiving solution that allows users to securely capture and retrieve documents and system-generated information. DataMagine integrates with other Agilysys products, adding functionality and providing seamless workflows that cross functional areas. DataMagine helps drive the Go Green initiative at a number of our customer sites by enabling a completely paperless experience through all facets of the customers operations – from signature capture at the front desk to automated routing of PO’s and requisition orders for approvals. DataMagine provides robust indexing and archiving features to allows easy contextual based document retrieval.
10

Agilysys Reserve solution is a guest-centric reservation and wait list management solution that helps operators to book any venue. The solution allows operators to manage restaurant, cabana and auditorium reservations. With an innovative doll house view approach, patrons have the ability to select and book a specific seat in a restaurant or a specific cabana on a pool deck online. With built in price yielding capabilities, Agilysys Reserve allows operators to maximize revenue opportunities for various locations. Using the built-in guest management system, operators can build guest profiles and provide a superior experience while driving repeat guests.

Agilysys Digital Marketing provides a flexible hospitality marketing automation solution supporting guest email and SMS marketing communications through event and campaign-based rules. Marketers can segment guests by type or other criteria and send context-related communications at time of reservation, check-in, check-out or by marketing campaign types. Digital email campaigns allow users an inexpensive way to stay connected to their guest throughout the guest journey. The result is increased return visits and improved revenue from targeted offers based upon guest segment and journey stage.

Agilysys Retail is our basic POS solution to support retail item sales in spas, gift shops or pro-shops that don’t need a full enterprise POS system. Easily setup and track inventory, sell items as part of other services, and consolidate it all on the guest folio.

Agilysys Central Reservations provides a single sign-on across multiple customer properties that allows staff to view guest profiles, trips, room availability across properties, make/modify/transfer reservations, scan property offers and rates, and more. The result is improved central reservations efficiency, increased revenue from cross-property sales and upsells, and superior guest service.

Agilysys Loyalty & Promotions provides a comprehensive loyalty and promotions management solution to help operators track guest preferences and craft a wide variety of programs and offers. Engage Loyalty supports point earning and redemption at every guest interaction and provides a guest portal for self-service account management. The result is increased guest wallet-share through repeat visits by leveraging guest preferences for targeted promotions and offers.

Agilysys Membership helps customers control membership programs by defining the membership types required. Whether customers manage memberships for individuals, families, groups, corporate accounts or all of these, they define the parameters for each. The membership Portal allows easy online registrations for new guests and gives guests the ability to check their balances and redeem points via gift cards, eCash, loyalty, and more.

Agilysys Residence Management is a comprehensive residence solution, including detailed reports that analyze residence profitability as well as the various expenses appropriated to a specific unit. Manage revenue allocations and splits, including expenses allocated between individual owners, the association and the property by leveraging an integrated and powerful set of Residence Management tools.
11

Agilysys Guest App is a downloadable customer-branded mobile guest engagement that app that provides a frictionless guest experience from booking to check-out. It combines a selection of Agilysys mobile applications in a single convenient app, including Agilysys Book for room, golf and spa reservations; Agilysys Express Mobile for mobile check in/out and digital room keys; and an administrative portal that provides a full content management system for complete control of branding, options, property images and more. It is available for iOS and Android mobile devices.
Inventory & Procurement Ecosystem Solutions:

Agilysys’ Eatec® solution provides core purchasing, inventory, recipe, forecasting, production and sales analysis functions and is unique in offering catering, restaurant, buffet management and nutrition modules in a single web-enabled solution. Agilysys’ Eatec Mobile is an optional app that can be downloaded from Google Play and Apple app stores and provides users with access to Eatec application from any Android® and iOS® device. Users can provide inventory receiving and transfer operations seamlessly from any mobile device even when they are offline using Eatec’s innovative store and forward capabilities.

Agilysys Stratton Warren System (SWS) integrates with all leading financial and POS software products. The software manages the entire procurement process via e-commerce, from business development to the management of enterprise-wide backend systems and daily operations. Agilysys SWS Direct is an add-on module for SWS that provides a convenient, efficient and intuitive shopping cart experience to SWS users. SWS Direct streamlines operations, provides enhanced bidding and request for pricing services, and offers supplier registration tools and self-service maintenance capabilities.
Representative Agilysys clients include:
7 Cedars Casino |
Drury Hotels |
Prairie Band Casino & Resort |
AVI Foodsystems, Inc. |
Ellis Island Hotel, Casino and Brewery |
Resorts World Bimini |
Banner Health |
Golden Nugget Lake Charles |
Rosen Hotels & Resorts |
Boyd Gaming Corporation |
Grand Sierra Resort and Casino |
Rosewood Castiglion Del Bosco |
Caesars Entertainment |
Hialeah Park |
Royal Caribbean Group |
Cal Dining at UC Berkeley |
Hilton Worldwide |
Spooky Nook Sports |
Camelback Lodge & Waterpark |
Inspire Resort Korea |
Station Casinos |
Carnival UK |
Intercontinental Hotel Group |
The Kessler Collection |
Cartoon Network Hotel |
Kimpton Hotels |
The Sea Pines Resort |
Casino del Sol Resort |
Longwood University |
The Venetian Resort Hotel Casino |
Catholic Charities |
Marina Bay Sands Singapore |
Treehouse – London |
Chukchansi Gold Resort & Casino |
Marriott International |
UT Southwestern Medical Center |
Compass Group North America |
Maryland Live! Casino |
Vail Resorts |
Comanche Nation of Oklahoma |
MGM |
Valley View Casino & Hotel |
The Cosmopolitan of Las Vegas |
Oxford Casino |
Wendover Resorts |
Dickies Arena |
Pinehurst Resort |
|
Industry and Markets
We are a technology software solutions company exclusively focused on the hospitality industry. Our products have been enabling mission-critical core hospitality operations for more than four decades. Our software solutions are required to run the operations of the hospitality business and designed to drive substantial customer benefits through increased revenue, improved operational efficiency, enhanced guest experience and improved employee morale. In addition, many of our solutions enable social distancing capabilities for our customers. Our innovative software solutions described above have been purpose-built to serve the unique needs of the following hospitality verticals: casinos, hotels, resorts, cruise ships, managed foodservice providers, sports and entertainment, and healthcare. We operate across North America, Europe, the Middle East, Asia-Pacific and India with headquarters located in Alpharetta, GA.
12
We estimate our total addressable market to be approximately $5 billion in annual recurring revenue opportunity. While the size of the opportunity might face pressure in an economic downturn, we feel it remains in the billions of dollars while our business represents only a fraction of that size. We believe we are well positioned to win market share given our relative competitive strength in the industry.
Customers
Our customers include large, medium-sized and boutique hospitality providers, both owned and franchised, as well as divisions or departments of large corporations in the hospitality industry. We concentrate on serving the needs of customers in a range of customer-focused settings where brand differentiation is important and guest recruitment is intense. Our customer base is highly fragmented.
Human Capital
As of March 31, 2024, we employed approximately 1,900 employees, with approximately 70%, 26%, 2%, and 1% of our employees located in India, North America, Asia-Pacific, and EMEA, respectively. We consider our relationship with our employees to be good and a critical factor in our success.
Our senior management team is responsible for developing and executing our human capital strategy. Agilysys’ key human capital management objectives are to attract, retain and develop talent to deliver on our strategy. Accordingly, we seek employees who share a passion for technology and its ability to improve our customers’ businesses in hospitality in accordance with our mission statement: helping our customers improve employee and guest experiences, with dedication to past, present and future customer investments in our products and services.
We believe that our culture is essential to maintaining high quality services and solutions. Our culture impacts the quality of the employees we hire, the way we develop and maintain solutions, and the way we communicate and interact with our customers and each other. Our culture is the cornerstone representing our values, our behaviors, our way of working and how we approach our business. To reinforce our culture, we operate according to the Agilysys Code of Business Conduct, available on our website http://www.agilysys.com, which mandates full compliance with applicable laws and regulations and helps to preserve the integrity of our Company.
We believe we offer fair, competitive compensation and benefits that support our employees’ overall well-being and foster their growth and development. We offer our employees pay and benefits packages that we believe are competitive with others throughout our industry, as well as within the local markets in which we operate, and align individual performance with our success. For example, we recently launched an employee stock purchase plan to allow employees to share in the success of the company.
Our employee town halls, conducted several times annually, play a vital role in fostering transparency, engagement, alignment, and a sense of community. These town halls provide a platform to recognize and celebrate employee achievements, milestones, and contributions, and provide an opportunity for employees to ask questions of leadership.
As recognition for our commitment to our employees, we were awarded a LinkedIn Top Company 2024 Award for midsize employers.
We are committed to providing our employees with an environment free of discrimination, harassment and workplace violence. We make all benefit and employment-related decisions in compliance with equal employment opportunity statutes and without regard to religion, national origin, age, gender, race, color, ancestry, sexual orientation, disability, marital status, citizenship, pregnancy, medical condition or any other protected class status, as defined by local, state or federal laws. All employees, directors, independent contractors, and other parties who work with Agilysys are expected to create a working environment where everyone is respected, regardless of individual differences. We believe that each of our employees' individual character, virtues, and individual experiences will leverage our ability to attract and retain quality employees, customers, and suppliers.
Seasonality
Occasionally, the timing of large one-time orders, such as those associated with significant remarketed product sales around large customer refresh cycles or significant volume rollouts, creates variability in our quarterly results.
Intellectual Property
13
We rely on a combination of patent, trade secret, copyright, and trademark laws, a variety of contractual arrangements, such as license agreements, assignment agreements, confidentiality and non-disclosure agreements, and confidentiality procedures and technical measures to gain rights to and protect the intellectual property used in our business.
We do not believe that our business is dependent on any single item of intellectual property, or that any single item of intellectual property is material to the operation of our business. However, since we consider trademarks to be a valuable asset of our business, we have an ongoing trademark and service mark registration program pursuant to which we register our brand names and product names, taglines, and logos in the United States and other countries to the extent we determine registration to be appropriate and cost effective.
We intend to pursue additional intellectual property protection to the extent we believe it would be beneficial and cost effective. Despite our efforts to protect our intellectual property rights, they may not be respected in the future or may be invalidated, circumvented, or challenged. See the sections titled “Risk Factors,” including the section titled “Risk Factors — We may not be able to enforce or protect our intellectual property rights” for a description of the risks related to our intellectual property.
Competition
Our solutions face a highly competitive market. Competition exists with respect to developing and maintaining relationships with customers, pricing for products and solutions, and customer support and service.
We compete with other full-service providers who sell and deliver bundled POS and PMS solutions comprised of software, hardware, subscription, maintenance, and professional services. These companies, some of which are much larger than we are, include Oracle Corp., Shiji, Amadeus IT Group and Infor. We also compete with smaller software companies who provide either POS or PMS solutions like Maestro. In addition, we compete with PMS systems that are designed and maintained in-house by large hotel chains.
Environmental Matters
We believe we are compliant in all material respects with all applicable environmental laws. Presently, we do not anticipate that such compliance will have a material effect on capital expenditures, earnings or competitive position with respect to any of our operations. For information about governmental regulations applicable to our business, refer to Item 1A Risk Factors included elsewhere in this Annual Report.
Access to Information
Our annual reports on Form 10-K, quarterly reports on Form 10-Q, current reports on Form 8-K and any amendments to these reports are available free of charge through our corporate website, http://www.agilysys.com, as soon as reasonably practicable after such material is electronically filed with, or furnished to, the Securities and Exchange Commission (SEC). Copies are also available without charge by a written request to Agilysys, Inc., Attention: Investor Relations, 3655 Brookside Parkway, Suite 300, Alpharetta, Georgia 30022 or by requesting copies through our website, under “Investor Relations.” The information posted on our website is not incorporated into this Annual Report. Reports, proxy and information statements, and other information regarding issuers that file electronically, are maintained on the SEC website, http://www.sec.gov.
Item 1A. Risk Factors.
Risks Relating to Our Business
Markets, Competition, and Operations
Our business is impacted by changes in macroeconomic and global conditions.
Because we conduct our business internationally, changes in global, national, or regional economies, governmental policies (including in areas such as trade, travel, immigration, healthcare, and related issues), political unrest, armed conflicts, natural disasters, or disease outbreaks may impact our business. Any general weakening of, and related declining corporate confidence in, the global economy or the curtailment in corporate spending could cause current or potential customers to reduce or eliminate their information technology budgets and spending, which could cause customers to delay, decrease or cancel purchases of our products and services; cause customers not to pay us; or to delay payment for previously purchased products and services.
Our business is negatively impacted by decreases in travel and leisure activities resulting from weak economic conditions, increases in energy prices and changes in currency values, political instability, heightened travel security measures, travel advisories, disruptions in air travel, and concerns over disease, violence, war, or terrorism. Our business, markets, growth prospects and business model could be materially impacted or altered as a result of adverse changes in travel and leisure activities due to a pandemic or other wide-ranging and sustained events.
14
Similarly, increases in energy prices can result in higher ingredient and food costs for our customers with restaurant operations, which may adversely affect demand for our customers’ restaurant businesses, and in turn, our business, financial results and liquidity.
Our future success will depend on our ability to develop new solutions, product upgrades and services that achieve market acceptance.
Our business is characterized by rapid and continual changes in technology and evolving industry standards. We believe that in order to remain competitive in the future we need to continue to develop new products, product upgrades and services, requiring the investment of significant financial resources. If we fail to accurately anticipate our customer’s needs and technological trends, or are otherwise unable to complete the development of a product or product upgrade on a timely basis, we will be unable to introduce new products or product upgrades into the market that are demanded by our customers and prospective customers on a timely basis, if at all, and our business and operating results would be materially and adversely affected.
The development process for most new products and product upgrades is complicated, involves a significant commitment of time and resources and is subject to a number of risks and challenges including:
Our product development activities are costly and recovering our investment in product development may take a significant amount of time, if it occurs at all. We anticipate continuing to make significant investments in software research and development and related product opportunities because we believe it is necessary to compete successfully.
Our product development activities also could be impacted by competition from products with new features or leveraging new technologies, such as artificial intelligence (AI), that render our existing products less competitive or obsolete. We may not respond effectively to the technological requirements of the changing market. If we need new technologies or if we are not able to develop new products or product upgrades acceptable to customers to remain competitive, the development, acquisition, and implementation of those new products, product upgrades or technologies may require us to make significant capital investments.
If we are not successful in managing these risks and challenges, or if our new products, product upgrades, and services are not technologically competitive or do not achieve market acceptance, our business and operating results could be adversely affected.
We face extensive competition in the markets in which we operate, and our failure to compete effectively could result in price reductions and/or decreased demand for our products and services.
Several companies offer products and services similar to ours. The rapid rate of technological change in the hospitality market makes it likely we will face competition from new products designed by companies not currently competing with us. We believe our competitive ability depends on our product offerings, our experience in the hospitality industry, our product development and systems integration capability, and our customer service organization. There is no assurance, however, that we will be able to compete effectively in the hospitality technology market in the future.
We compete for customers based on several factors, including price. The competitive markets in which we operate may oblige us to reduce our prices in order to contend with the pricing models of our competitors. If our competitors discount certain products or services, we may have to lower prices on certain products or services in order to attract or retain customers. Any such price modifications would likely reduce margins and could have adverse effects. In addition, if we fail to reduce our prices in order to contend with the pricing models of our competitors, we may not be able to retain customers or grow our business, which could adversely affect our revenues and liquidity.
Our future success depends on our ability to execute on strategic initiatives, to properly manage investments in our business, and to enhance our existing operations and infrastructure.
Our long-term strategy is focused on continually investing in and growing our business and operations, both organically and through acquisitions.
Investments in new markets, solutions, and technologies, research and development, infrastructure and systems, geographic expansion, and talent are critical components for realizing our strategy. In particular, we believe we must continue to dedicate a significant
15
amount of resources to our research and development efforts to maintain our competitive position. Our investments in research and development may result in products or services that generate less revenue than we anticipate.
Such investments present challenges and risks and may not be successful financially or otherwise, especially in new areas in which we have little or no experience, and even if successful, may negatively impact our short-term profitability. To succeed in such efforts, we must be able to properly deploy financial and other resources, prioritize among opportunities, balance the extent and timing of investments with the associated impact on profitability, balance our focus between new areas and the servicing of our existing customers, capture efficiencies and economies of scale, and compete in the new areas, or with the new solutions, in which we have invested.
Our success also depends on our ability to effectively and efficiently enhance our existing operations. Our existing infrastructure, systems, security, processes, and personnel may not be adequate for our current or future needs. System upgrades or new implementations can be complex, time-consuming, and expensive and we cannot assure you that we will not experience problems during or following such implementations, including among others, potential disruptions in our operations or financial reporting.
If we are unable to properly execute on growth initiatives, manage our investments, and enhance our existing operations and infrastructure, our results of operations and market share may be materially adversely affected.
Our dependence on certain suppliers makes us vulnerable to the extent we rely on them.
We rely on a concentrated number of suppliers for the majority of our hardware and for certain software and related services needs. We do not have long term agreements with many of these suppliers. If we can no longer obtain these hardware, software or services needs from our major suppliers due to mergers, acquisitions or consolidation within the marketplace, material changes in their partner programs, their refusal to continue to supply to us on reasonable terms or at all, and we cannot find suitable replacement suppliers, it may have a material adverse impact on our future operating results and gross margins.
If we cannot retain and recruit qualified personnel due to rising labor costs or other reasons, our ability to operate and grow our business may be impaired and our financial performance may suffer.
We depend on the services of our management and employees to continuously run and grow our business. To grow successfully, we must retain existing employees and attract new qualified employees, particularly in growth areas we have identified. Employee retention is an industry challenge especially given the competitive labor market for software developers. As we grow, we must also enhance and expand our workforce to execute on new and larger opportunities. The market for qualified personnel is competitive in the geographies in which we operate and may be limited in the software development disciplines we seek to expand. We may be at a disadvantage to larger companies with greater brand recognition or financial resources or to start-ups or other emerging companies in trending market sectors. If we are unable to attract and retain qualified personnel when and where they are needed, our ability to operate and grow our business could be impaired. Moreover, if we are not able to properly balance our investments in personnel with revenue growth, our profitability may be adversely affected.
Our international operations have many associated risks.
We continue to strategically manage our presence in international markets, and these efforts require significant management attention and financial resources. We may not be able to successfully penetrate international markets, or, if we do, there can be no assurance that we will grow our business in these markets at the same rate as in North America. Because of these inherent complexities and challenges, lack of success in international markets could adversely affect our business, results of operations, cash flow, and financial condition.
We have international offices in Canada, the United Kingdom, Dubai, China, Hong Kong, Malaysia, the Philippines, Singapore, and India. We have committed resources to maintaining and further expanding, where appropriate, our sales offices and sales and support channels in key international markets. However, our efforts may not be successful. International sales are subject to many risks and difficulties, including those arising from the following: building and maintaining a competitive presence in new markets; staffing and managing foreign operations; complying with a variety of foreign laws, rules and regulations; producing localized versions of our products; developing integrations between our products and other locally-used products; import and export restrictions and tariffs, enforcing contracts and collecting accounts receivable; unexpected changes in regulatory requirements; reduced protection for intellectual property rights in some countries; potential adverse tax treatment; language and cultural barriers; foreign currency fluctuations; inflation and any regulatory actions to counter inflation; and political and economic instability abroad.
Natural disasters or other catastrophic events affecting our principal facilities could cripple our business.
16
Natural disasters or other catastrophic events, particularly those affecting employees in our Alpharetta headquarters or India research and development center, may cause damage or disruption to our operations, and thus could have a negative effect on us. Most of our administrative functions are concentrated in our Alpharetta headquarters and most of our software development activity is concentrated in our India research and development center. While we maintain crisis management and disaster response plans, a natural disaster, fire, power shortage, pandemic, act of terrorism or other catastrophic event occurring in either geographic location that prevents or substantially impairs our employees’ ability to work, either in the office or from home, could make it difficult or impossible for us to deliver our products and services to customers.
Regulatory Matters, Information Security, Data Privacy, and Product Stability
Our products and services may not function properly if we experience significant coding or configuration errors.
Despite testing prior to the release and throughout the lifecycle of a product or service, our on-premise and cloud-based solutions sometimes contain coding or configuration errors that can impact their function, performance and security, and result in other negative consequences. The detection and correction of any errors in released on-premise or cloud-based solutions can be time consuming and costly. Errors in our on-premise and cloud-based solutions could affect their ability to properly function, integrate or operate with other software or hardware offerings, could result in service interruptions, delays or outages, could create security vulnerabilities in our products or services, could delay the development or release of new products or services or new versions of products or services, and could adversely affect market acceptance of our products or services. This includes third-party software products or services incorporated into our own. If we experience any of these errors, or if there are delays in releasing our on-premise or cloud-based solutions or new versions of these offerings, our sales could be affected and revenues could decline. Customers rely on our on-premise and cloud-based solutions and related services to run their businesses, and errors in our solutions and related services could expose us to product liability, performance and warranty claims as well as significant harm to our brand and reputation, which could impact our future sales.
Implementation of software solutions often involves a significant commitment of resources, and any failure to deliver as promised on a significant implementation could adversely affect our business.
The implementation of software solutions often involves a significant commitment of resources and is subject to a number of significant risks over which we may or may not have control. These risks include:
As a result of these and other risks, some of our customers may incur large, unplanned costs in connection with the purchase and installation of our solutions. Also, implementation projects could take longer than planned or fail. We may not be able to reduce or eliminate protracted installation or significant additional costs. Significant delays or unsuccessful customer implementation projects could result in cancellation or renegotiation of existing agreements, claims from customers, harm our reputation and negatively impact our operating results.
We use open-source software in our solutions that may subject our solutions to general release or require us to re-engineer our solutions.
We use open-source software in our solutions and may use more open-source software in the future. From time to time, there have been claims by companies claiming ownership of software that was previously thought to be open-source and that was incorporated by other companies into their products. As a result, we could be subject to suits by parties claiming ownership of what we believe to be open-source software.
Some open-source licenses contain requirements that we make available source code for modifications or derivative works we create based upon the open-source software and that we license these modifications or derivative works under the terms of a particular open-source license or other license granting third parties certain rights of further use. If we combine or, in some cases, link our proprietary software solutions with or to open-source software in a certain manner, we could, under certain of the open-source licenses, be required to release the source code of our proprietary software solutions or license such proprietary solutions under the terms of a particular open-source license or other license granting third parties certain rights of further use.
17
In addition to risks related to license requirements, usage of open-source software can lead to greater risks than use of third-party commercial software, as open-source licensors generally do not provide warranties or controls on origin of the software. In addition, open-source license terms may be ambiguous and many of the risks associated with usage of open-source cannot be eliminated, and could, if not properly addressed, negatively affect our business. If we were found to have inappropriately used open-source software, we may be required to seek licenses from third parties in order to continue offering our software, to re-engineer our solutions, to discontinue the sale of our solutions in the event re-engineering cannot be accomplished on a timely basis or take other remedial action that may divert resources away from our development efforts, any of which could adversely affect our business, operating results and financial condition.
We are subject to complex, evolving regulatory requirements that may be difficult and expensive to comply with and that could negatively impact us or our business.
Our business and operations are subject to a variety of regulatory requirements in the countries in which we operate or in which we offer our solutions, including, among other things, with respect to data privacy, artificial intelligence (“AI”), information security, trade compliance, tax, and labor matters.
In addition, as we are increasingly building and licensing from third party providers new and evolving technologies, such as AI, machine learning, analytics, and biometrics, as part of our offerings, our business and operations may become subject to additional complex and evolving regulatory requirements pertaining to the sale or use of these technologies. The evolving regulatory environment surrounding these new technologies may also increase our research and development costs, compliance costs, and confidentiality and security risks, and result in inconsistencies in evolving legal frameworks across jurisdictions. The sale of these technologies, or their use by us or by our customers or partners, may also subject us to additional risks, including reputational harm, competitive harm or legal liabilities, due to their perceived or actual impact on human rights, privacy, employment, or in other social or discriminatory contexts. Third-parties may criticize us or seek to hold us responsible not only for our own activities in this regard but also for the activities of our customers or partners.
We anticipate that we will become subject to an increasing amount of regulation and disclosure requirements related to environmental, social and governance (“ESG”) matters. In addition, stakeholders, including investors, customers, suppliers and employees, may pressure us to make commitments on these matters that may be difficult to manage or achieve. If we fail to make or meet such commitments, we may be subject to criticism, reputational harm or legal liability.
The application of these laws and regulations to our business is often unclear and may at times conflict. Compliance with applicable regulatory requirements may be onerous, time-consuming, and expensive, especially where these requirements are inconsistent from jurisdiction to jurisdiction or where the jurisdictional reach of certain requirements is not clearly defined or seeks to reach across national borders. Regulatory requirements in one jurisdiction may make it difficult or impossible to do business in or comply with the rules of another jurisdiction.
While we endeavor to implement policies, procedures, and systems designed to achieve compliance with these regulatory requirements, we cannot assure you that these policies, procedures, or systems will be adequate or that we or our personnel will not violate these policies and procedures or applicable laws and regulations. Violations of these laws or regulations may harm our reputation and deter government agencies and other existing or potential customers or partners from purchasing our solutions. Furthermore, non-compliance with applicable laws or regulations could result in fines, damages, criminal sanctions against us, our officers, or our employees, restrictions on the conduct of our business, and damage to our reputation.
Cyber-attacks involving our systems and data could expose us to liability or harm our reputation and have a material adverse effect on our business.
We rely on information technology networks and systems, some of which are owned and operated by third parties, to collect, process, transmit, and store electronic information on behalf of our customers. We also depend on our information technology infrastructure for a variety of functions, including worldwide financial reporting, procurement, invoicing, and email communications. These systems are susceptible to outages due to fire, floods, power loss, telecommunications failures, hacking, terrorist attacks, and similar events.
We have implemented security measures and controls intended to protect our IT infrastructure, data centers and other systems and data against cyber-attacks. Despite our implementation of security measures and controls, our systems and those of third parties upon whom we rely are vulnerable to attack from numerous threat actors, including sophisticated nation-state and nation-state-supported actors. Threat actors have and may in the future be able to compromise our security measures or otherwise exploit vulnerabilities in our systems, including vulnerabilities that may have been introduced through the actions of our employees or contractors or defects in the design or manufacture of our products and systems or the products and systems that we procure from third parties. Our systems, and those of our third-party providers, have and could in the future become subject to cyber-attacks, including using computer viruses,
18
credential harvesting, dedicated denial of services attacks, malware, social engineering, and other means for obtaining unauthorized access to, or disrupting the operation of, our systems and those of our third-party providers.
In addition, threat actors are also increasingly using tools and techniques that circumvent controls, evade detection, and remove forensic evidence, which means that we and others may be unable to anticipate, detect, deflect, contain or recover from cyberattacks in a timely or effective manner. As AI capabilities improve and are increasingly adopted, we may see cyberattacks created through AI. These attacks could be crafted with an AI tool to directly attack IT systems with increased speed and/or efficiency than a human threat actor or create more effective phishing emails. Our network and storage applications, as well as those of our customers, business partners, and third-party providers, may be subject to unauthorized access by hackers or breached due to operator error, malfeasance or other system disruptions.
The number and scale of cyberattacks have continued to increase and the methods and techniques used by threat actors, including sophisticated “supply-chain” attacks, continue to evolve at a rapid pace. As a result, we may be unable to identify current attacks, anticipate future attacks or implement adequate security measures. We may also experience security breaches that may remain undetected for an extended period and, therefore, have a greater impact on our systems, our products, the proprietary data contained therein, our customers and ultimately, our business.
For example, we use Progress Software’s MOVEit Transfer application to enable file transfers with some of our customers. On May 31, 2023, Progress Software disclosed that it had identified a previously unknown vulnerability in its MOVEit Transfer application. We immediately followed the recommendations from Progress Software to address the vulnerabilities in the MOVEit Transfer application. However, we identified unauthorized file downloads from our MOVEit Transfer application impacting about 130 customers who used our InfoGenesis POS, Eatec and Agilysys Analyze products. All impacted customers were notified in June 2023, and the incident has not had a material adverse effect on our business, financial condition, or results of operation.
Cyberattacks on our systems and “supply-chain” attacks on systems of third parties upon whom we rely, and any related operational disruptions, unauthorized access, or misappropriation of information (including personally identifiable information or personal data), could create costly litigation, significant financial liability, and a loss of confidence in our ability to serve customers and cause current or potential customers to choose another provider, all of which could have a material adverse effect on our business, financial condition, reputation, and results of operations.
Privacy, information security, and data protection laws, rules, and regulations could affect or limit how we collect and use personal information, increase our costs, and adversely affect our business opportunities. A failure to comply with applicable privacy or data protection laws could harm our reputation and have a material adverse effect on our business.
We collect, process, transmit, and/or store (on our systems and those of third-party providers) customer transactional data, as well as their and our customers’ and employees’ personally identifiable information and/or other data and information. Personally identifiable information is increasingly subject to legislation and regulations in numerous jurisdictions with regard to privacy and data security such as the California Consumer Privacy Act and the European Union’s General Data Protection Regulation. Moreover, what constitutes personally identifiable information and what other data and/or information is subject to the privacy laws varies by jurisdiction and continues to evolve, and the laws that do reference data privacy continue to be interpreted by the courts and their applicability and reach are therefore uncertain. Our failure and/or the failure of our customers, vendors, and service providers to comply with applicable privacy and data protection laws and regulations could damage our reputation, discourage current and/or potential customers from using our products and services, and result in fines, governmental investigations and/or enforcement actions, complaints by private individuals, and/or the payment of penalties to consumers.
In addition, many U.S. and foreign laws and regulations, including those promulgated by the SEC, require companies to provide notice of cybersecurity incidents involving certain types of personal data or unauthorized access to, or interference with, our information systems to the public, certain individuals, the media, government authorities, or other third parties. Certain of these laws and regulations include notice or disclosure obligations contingent upon the result of complex analyses, including in some cases a determination of materiality. The nature of cybersecurity incidents can make it difficult to quickly and comprehensively assess an incident's overall impact to our business, and we may make errors in our assessments. If we are unable to appropriately assess a cybersecurity incident in the context of required analyses then we could face compliance issues under these laws and regulations, and we could be subject to lawsuits, regulatory fines or investigations, or other liabilities, any or all of which could adversely affect our business and operating results. Furthermore, cybersecurity incidents experienced by us, or by our customers or vendors, that lead to public disclosures may also lead to widespread negative publicity and increased government or regulatory scrutiny. Any security compromise in our industry, whether actual or perceived, could harm our reputation; erode customer confidence in our security measures; negatively affect our ability to attract new customers; or subject us to third-party lawsuits, regulatory fines or investigations, or other liability, any or all of which could adversely affect our business and operating results. Even the perception of inadequate security may damage our reputation and negatively impact our ability to win new customers and retain existing customers.
19
Additionally, we could be required to expend significant capital and other resources to investigate and address any actual or suspected cybersecurity incident or to prevent further or additional incidents. To maintain business relationships, we may find it necessary or desirable to incur costs to provide remediation and incentives to customers or other business partners following an actual or suspected security incident. We also cannot be sure that our existing cybersecurity insurance will continue to be available on acceptable terms, in sufficient amounts to cover any claims we submit, or at all. Further, we cannot be sure that insurers will not deny coverage as to any claim, and some security incidents may be outside the scope of our coverage, including in instances where they are considered force majeure events. Security incidents may result in increased costs for cybersecurity insurance. One or more large, successful claims against us in excess of our available insurance coverage, or changes in our insurance policies, including premium increases or large deductible or co-insurance requirements, could have an adverse effect on our business, operating results, and financial condition.
Actual or perceived security vulnerabilities in our software solutions may result in reduced sales or liabilities.
We have implemented policies and procedures, and use information technology systems, to help ensure the proper handling of our customers and their customers data from both a data privacy and an information security perspective. We also evaluate the information security of potential partners and vendors as part of our selection process and attempt to negotiate adequate protections from such third parties when we enter into contracts with them. Our customer contracts also obligate our customers to undertake steps necessary for satisfying individual rights under laws and regulations. While these policies, procedures, systems, contractual provisions, and measures are designed to mitigate the risks associated with handling or processing personal data, including categories of personal data which may be classed as sensitive data, they cannot always safeguard against all risks, nor can we control the actions of third parties, including vendors, customers and partners. In addition, it may be possible for customer and guest data to be compromised from customers’ information technology systems if our customer does not maintain appropriate data privacy and information security procedures.
The improper handling of personal data including sensitive data, or even the perception of such mishandling (whether or not valid), or other security lapses or breaches affecting us, our partners, our customers, or our products or services, could reduce demand for our products or services or otherwise expose us to financial or reputational harm or legal liability.
For certain products and services, including our cloud hosting operations, we rely on third-party providers, which may create significant risk exposure for us.
We maintain relationships with third parties to provide certain services to us or to our customers, including cloud hosting and other cloud-based services. We make contractual obligations to customers based on these relationships and, in some cases, also entrust these providers with both our own sensitive data as well as the sensitive data of our customers (that may include sensitive guest data). If these third-party providers do not perform as expected or encounter service disruptions, cyber-attacks, data breaches, or other difficulties, we or our customers may be materially and adversely affected, including, among other things, by facing increased costs, potential liability to customers, guests, or other third parties, regulatory issues, and reputational harm. If it is necessary to migrate these services to other providers because of poor performance, security considerations, or other financial or operational factors, it could result in service disruptions to our customers and significant time, expense, or exposure to us, any of which could materially adversely impact our business.
We also purchase hardware and technology, in some cases, by or from companies that may compete with us or work with our competitors. While we endeavor to use larger, more established providers wherever possible, in some cases, these providers may be smaller, less established companies, particularly in the case of new or unique technologies that we have not developed internally, or in an effort to benefit our margins.
If any of these providers experience financial, operational, or quality assurance difficulties, or if any cease production, or there is any other disruption in the services we or our customers receive, including as a result of the acquisition of a supplier or partner by a competitor, macroeconomic issues, or otherwise, we will be required to locate and migrate to alternative sources or providers, to internally develop the applicable technologies, to redesign our products, or to remove certain features from our products or to reduce our service levels, any of which would likely increase our expenses, create delays, or negatively impact our revenues. Although we strive to establish contractual protections with key providers, such as source code escrows, warranties, and indemnities, we may not be successful in obtaining adequate protections, these agreements may be short-term in duration, and the counterparties may be unwilling or unable to stand behind such protections. Moreover, these types of contractual protections offer limited practical benefits to us in the event our relationship with a key provider is interrupted.
We may not be able to enforce or protect our intellectual property rights.
20
We rely on a combination of copyright, patent, trademark and trade secret laws and restrictions on disclosure to protect our intellectual property rights. We cannot be certain that the steps we have taken will prevent unauthorized use of our technology. Any failure to protect our intellectual property rights would diminish or eliminate the competitive advantages that we derive from our proprietary technology.
We may be subject to claims of infringement of third-party intellectual property rights.
Third parties may assert claims that our software or technology infringe, misappropriate, or otherwise violate their intellectual property or other proprietary rights. Such claims may be made by our competitors seeking to obtain a competitive advantage or by other parties. The risk of claims may increase as the number of software products that we offer and competitors in our market increase and overlaps occur. Any such claims, regardless of merit, that result in litigation could result in substantial expenses, divert the attention of management, cause significant delays in introducing new or enhanced services or technology, materially disrupt the conduct of our business, and have a material adverse effect on our business, financial condition, and results of operations.
While we do not believe that our products and services infringe any patents or other intellectual property rights, from time to time, we receive claims that we have infringed the intellectual property rights of others. For example, on April 6, 2012, Ameranth, Inc. filed a complaint against us in the U.S. District Court for the Southern District of California, alleging that certain of our products infringe patents owned by Ameranth directed to configuring and transmitting hospitality menus (e.g., restaurant menus) for display on electronic devices, and synchronizing the menu content between the devices. Although judgement was entered for us and against Ameranth on all claims in that suit in 2022, the litigation resulted in substantial expenses, even though it did not have a material adverse effect on our business, financial condition, and results of operations.
If we fail to meet our customers’ performance expectations, our reputation may be harmed, and we may be exposed to legal liability.
Our ability to attract and retain customers depends to a large extent on our relationships with our customers and our reputation for high quality services and solutions. As a result, if a customer is not satisfied with our products and services, our reputation may be damaged. Moreover, if we fail to meet our customers’ performance expectations or if customers experience service disruptions, breaches or other quality issues, we may lose customers and be subject to legal liability, particularly if such failure, service disruptions or breaches adversely impact our customers’ businesses.
In addition, many of our projects are critical to the operations of our customers’ businesses. While our contracts typically include provisions designed to limit our exposure to legal claims relating to our products and services, these provisions may not adequately protect us or may not be enforceable in all cases. The general liability insurance coverage that we maintain, including coverage for errors and omissions, is subject to important exclusions and limitations. We cannot be certain that this coverage will continue to be available on reasonable terms or will be available in sufficient amounts to cover one or more large claims, or that the insurer will not disclaim coverage as to any future claim. A successful assertion of one or more large claims against us that exceeds our available insurance coverage or changes in our insurance policies, including premium increases or the imposition of large deductible or co-insurance requirements, could adversely affect our profitability.
Risks Relating to the Industries We Serve
Our business depends to a significant degree on the hospitality industry and instability and downturns in the hospitality industry could adversely affect our business and results of operations.
Because our customer base is concentrated in the hospitality industry, our business and sales are largely dependent on the health of that industry, which in turn is dependent on the domestic and international economy. Instabilities or downturns in the hospitality industry, such as those resulting from the impacts of pandemics, could disproportionately impact our revenue, as customers may exit the industry or delay, cancel or reduce planned expenditures for our products.
Consolidation in the gaming and other hospitality industries could adversely affect our business.
Customers that we serve may seek to achieve economies of scale and other synergies by combining with or acquiring other companies. The hospitality industry has experienced recent consolidations, including the hotel and gaming sectors of the industry. Although recent consolidations in the hospitality industry have not materially adversely affected our business, there is no assurance that future consolidations will not have such affect. For example, if one of our current customers merges or consolidates with a company that relies on another provider’s products or services, it could decide to reduce or cease its purchases of products or services from us, which could have an adverse effect on our business.
21
Insolvencies in the hospitality industry could adversely affect our business.
Customers that we serve may be or become insolvent. Loss of revenue and other operating challenges may cause some of our customers to declare bankruptcy or cause their lenders to declare a default, accelerate the related debt, or foreclose on their property. Customers in bankruptcy may not have sufficient assets to pay us unpaid fees or reimbursements we are owed under their agreements with us. If a significant number of customers file for bankruptcy or otherwise fail to pay amounts owed to us, our revenues and liquidity could be adversely affected.
Risks Relating to Our Finances and Capital Structure
Our stock has been volatile and we expect that it will continue to be volatile.
During the year ended March 31, 2024, the trading price of our common stock ranged from a low close of $63.77 to a high close of $91.40. The market price for our common stock could be subject to wide fluctuations in response to many risk factors listed in this section, and others beyond our control. Factors affecting the trading price of our common stock may include:
Additionally, our ownership base has been and may continue to be concentrated in a few shareholders, which could increase the volatility of our common share price over time.
If we acquire new businesses, we may not be able to successfully integrate them or attain the anticipated benefits.
As part of our operating history and growth strategy, we have acquired other businesses. In the future, we may continue to seek acquisitions. We can provide no assurance that we will be able to identify and acquire targeted businesses or obtain financing for such acquisitions on satisfactory terms. The process of integrating acquired businesses into our operations may result in unforeseen difficulties and may require a disproportionate amount of resources and management attention. If integration of our acquired businesses is not successful, we may not realize the potential benefits of an acquisition or suffer other adverse effects.
Our financial results may be significantly impacted by changes in our tax position.
We are subject to taxes in the United States and numerous foreign jurisdictions. Our future effective tax rates could be impacted by changes in the mix of earnings in countries with differing statutory tax rates, changes in the valuation allowance on deferred tax assets (including our net operating loss carryforwards), changes in unrecognized tax benefits, or changes in tax laws or their interpretation. Any of these changes could have a material adverse effect on our profitability. In addition, the tax authorities in the jurisdictions in which we operate, including the United States, may from time to time review the pricing arrangements between us and our foreign subsidiaries or among our foreign subsidiaries. An adverse determination by one or more tax authorities in this regard may have a material adverse effect on our financial results.
We have significant deferred tax assets which can provide us with significant future cash tax savings if we are able to use them, including significant net operating losses. However, the extent to which we will be able to use these net operating losses may be impacted, restricted, or eliminated by a number of factors, including changes in tax rates, laws or regulations, and whether we generate sufficient future taxable income. To the extent that we are unable to utilize our net operating losses or other losses, our results of operations, liquidity, and financial condition could be materially adversely impacted. When we cease to have net operating losses available to us in a particular tax jurisdiction, either through their expiration, disallowance, or utilization, our cash tax liability will increase in that jurisdiction.
We are exposed to foreign currency exchange rate fluctuations that could negatively impact our financial results.
22
We earn revenue, pay expenses, own assets, and incur liabilities in countries using currencies other than the U.S. dollar, including the British pound sterling, euro, Indian rupee, Australian dollar, Singapore dollar, and Canadian dollar, among others. Because our consolidated financial statements are presented in U.S. dollars, we must translate revenue, expenses, assets, and liabilities of entities using non-U.S. dollar functional currencies into U.S. dollars using currency exchange rates in effect during or at the end of each reporting period, meaning that we are exposed to the impact of changes in currency exchange rates. In addition, the revaluation and settlement of monetary assets and liabilities denominated in currencies other than the U.S. dollar impact our net income with associated gains or losses recorded within other income (expense), net.
We may have exposure to greater than anticipated tax liabilities.
Some of our products and services may be subject to sales taxes in jurisdictions where we have not collected and remitted such taxes from our customers. We believe we have appropriately accrued for these contingencies. In the event actual results differ, we may need to make adjustments, which could materially impact our financial condition and results of operations.
We may incur goodwill and intangible asset impairment charges that adversely affect our operating results.
As of March 31, 2024, we had $32.8 million of goodwill and $17.0 million of intangible assets, net, on our Consolidated Balance Sheet. We review our indefinite-lived intangible assets including goodwill for impairment on at least an annual basis or more frequently if an event or events indicate the potential for impairment. We assess as needed whether there have been impairments in our other intangible assets. We make assumptions and estimates in our assessments that can be complex and subjective. In our assumptions and estimates we consider whether negative factors exist such as deteriorating economic conditions, disruptions to our business, inability to effectively integrate acquired businesses, intensified competition, market capitalization declines, or significant changes in use of the intangible assets. To the extent that such factors or other negative factors emerge, we may record non-cash impairment charges in the future that could negatively impact our financial condition and results of operations.
We may encounter risks associated with maintaining large cash balances.
While we have attempted to invest our cash balances in investments we considered to be relatively safe, we nevertheless confront credit and liquidity risks. Bank failures could result in reduced liquidity or the actual loss of money held in deposit accounts in excess of federally insured amounts, if any.
Other Risk Factors
Provisions of our corporate governance documents and Delaware Law could make an acquisition of the company more difficult and may prevent attempts by our stockholders to replace or remove our current management, even if beneficial to our stockholders.
Our certificate of incorporation and bylaws and the Delaware General Corporation Law (the “DGCL”), contain provisions that could make it more difficult for a third party to acquire us, even if doing so might be beneficial to our stockholders. These provisions include:
In addition, Section 203 of the DGCL may affect the ability of an “interested stockholder” to engage in certain business combinations, for a period of three years following the time that the stockholder becomes an “interested stockholder.”
Because our board of directors is responsible for appointing the members of our management team, these provisions could in turn affect any attempt to replace current members of our management team. As a result, you may lose your ability to sell your stock for a price in excess of the prevailing market price due to these protective measures, and efforts by stockholders to change the direction or management of the company may be unsuccessful.
23
Accounting principle updates could have a negative impact on our financial condition or operating results.
We prepare our Consolidated Financial Statements in conformity with U.S. generally accepted accounting principles (“GAAP”). Our application of new accounting principles can have a significant impact on our operating results including previously reported results subject to any retroactive treatment. In addition, new accounting principles may require significant changes to certain aspects of our business including how we operate and contract with our customers and suppliers. In order to manage such changes, we may incur significant costs to implement and maintain potentially extensive updates to our accounting systems and internal control over financial reporting that could negatively impact our financial condition and the results of our operations. Furthermore, difficulties or delays in applying new accounting principles could result in a failure to meet our financial reporting obligations.
If we fail to maintain an effective system of internal controls, we may be unable to prevent or detect fraud or internal control deficiencies including material weaknesses, which could have a material adverse impact on our business.
We design and operate our internal control over financial reporting to provide reasonable assurance about the reliability of financial reporting including the preparation of our Consolidated Financial Statements in accordance with GAAP. Because of its inherent limitations, our system of internal control over financial reporting may not prevent or detect every misstatement. Accordingly, although the Company’s management has concluded that our internal controls are effective as of March 31, 2024, we cannot provide absolute assurance that the objectives of our controls system are met. No evaluation of internal controls can provide absolute assurance that control matters and instances of fraud, if any, within our Company have been detected.
Item 1B. Unresolved Staff Comments.
None.
Item 1C. Cybersecurity.
We have an enterprise-wide information security program designed to identify, protect, detect and respond to and manage reasonably foreseeable cybersecurity risks and threats. To protect our information systems from cybersecurity threats, we use various security tools and third-party managed security services that help prevent, identify, escalate, investigate, resolve and recover from identified vulnerabilities and security incidents in a timely manner. These include, but are not limited to, internal reporting, monitoring and detection tools. We also evaluate the information security of potential partners and vendors as part of our selection process and attempt to negotiate adequate protections from such third parties when we enter into contracts with them. Although our security program is designed to identify, prioritize, assess, mitigate and remediate third party risks,, we rely on our partners and vendors to implement security programs commensurate with their risk, and we cannot ensure in all circumstances that their efforts will be successful.
We regularly assess risks from cybersecurity and technology threats and monitor our information systems for potential vulnerabilities. We use a widely-adopted risk quantification model to identify, measure and prioritize cybersecurity and technology risks and develop related security controls and safeguards. We conduct regular reviews and tests of our information security program and also leverage tabletop exercises, penetration and vulnerability testing, and third-party red team exercises to evaluate the effectiveness of our information security program and improve our security measures and planning. We also engage an external auditor to conduct annual Security and Organizational Controls 2 (SOC 2) examination of the security controls for systems storing customer data. The external auditor also conducts an annual payment card industry (PCI) data security standard review of our security controls protecting payment information, as well as third-party penetration testing of our cardholder environment and related systems.
Our systems periodically experience directed attacks intended to lead to interruptions and delays in our service and operations as well as loss, misuse or theft of personal information (of third parties, employees, and our customers) and other data, confidential information or intellectual property, and we have experienced an unauthorized release of certain data. However, to date no cybersecurity incidents have had a material impact on our business, financial condition or results of operations, and we are not presently aware of any cybersecurity threats that are reasonably likely to materially affect us. Any significant disruption to our service or access to our systems could result in a loss of customer data and adversely affect our business and results of operation. Further, a penetration of our systems or a third-party’s systems or other misappropriation or misuse of personal information could subject us to business, regulatory, litigation and reputation risk, which could have a material adverse effect on our business, financial condition and results of operations. See "Risk Factors — Cyber-attacks involving our systems and data could expose us to liability or harm our reputation and have a material adverse effect on our business.”
The Vice President and Chief Information Security Officer (CISO) leads the global information security organization responsible for overseeing our information security program. Our CISO has over 25 years of industry experience, including serving in similar roles
24
leading and overseeing cybersecurity programs at other public companies, and is a Certified Information Security Professional and Information Systems Security Architecture Professional. Team members who support our information security program have relevant educational and industry experience, including holding similar positions at large technology companies. Given the nature of our business, management is highly focused on identifying and managing cybersecurity risks, and our CISO and information security teams provide regular reports to senior management and other relevant teams on various cybersecurity threats, assessments and findings.
The Board has primary responsibility for oversight of the Company’s cybersecurity risks. The Audit Committee is also responsible for reviewing the Company’s information and cybersecurity risks and the steps that management has taken to protect against threats to the Company’s information systems and security, including results of periodic security assessments performed in conjunction with ongoing monitoring. The Audit Committee has formed a Cybersecurity Risk Subcommittee consisting of two independent directors to assist the Audit Committee in its oversight of cybersecurity risks. By its charter, all members of the Cybersecurity Risk Subcommittee must have a background or experience in information technology or cybersecurity and an understanding of cyber threats, risk mitigation and policy.
The results of our SOC2 and PCI assessments are reported to the Cybersecurity Risk Subcommittee. Both the Subcommittee and the Board receive regular reports from our CISO on various cybersecurity matters, including risk assessments, mitigation strategies, areas of emerging risks, incidents and industry trends, and other areas of importance. The Board also oversees our annual enterprise risk assessment, where we assess key risks within the company, including security and technology risks and cybersecurity threats.
Item 2. Properties.
Our corporate headquarters are located in Alpharetta, Georgia where we lease approximately 22,000 square feet of office space. In addition, we lease approximately 36,000 square feet of office space in Las Vegas, Nevada, 8,000 square feet of office space in Bellevue, Washington, 5,000 square feet of office space in Santa Barbara, California, and 6,000 square feet of warehouse space in Roswell, Georgia. Internationally, we lease approximately 182,000 square feet of office space in Chennai, India, 7,000 square feet in Toronto, Canada, and lease several other smaller office locations throughout Europe and Asia. Our major leases contain renewal options for periods of up to 10 years. We believe our office space facilities are sufficient to meet our current needs and do not anticipate any difficulty securing additional space as needed.
Item 3. Legal Proceedings.
We are involved in legal actions that arise in the ordinary course of business. It is the opinion of management that the resolution of any current pending litigation will not have a material adverse effect on our financial position or results of operations.
On April 6, 2012, Ameranth, Inc. filed a complaint against us in the U.S. District Court for the Southern District of California alleging that certain of our products infringe patents owned by Ameranth directed to configuring and transmitting hospitality menus (e.g., restaurant menus) for display on electronic devices, and synchronizing the menu content between devices. On May 11, 2022, final judgement was entered for us and against Ameranth on all claims in that suit. In March 2024, we settled all remaining issues with Ameranth, although the case remains open pending court approval of the settlement agreement.
Item 4. Mine Safety Disclosures.
Not applicable.
25
Item 4A. Information About Our Executive Officers.
The following table provides information with respect to all persons serving as executive officers as of May 17, 2024, including business experience for the last five years.
Name |
Position |
Age |
Executive Officer Since |
Ramesh Srinivasan |
President and Chief Executive Officer since January 2017. |
64 |
2017 |
Kyle Badger |
Senior Vice President, General Counsel and Secretary since October 2011. |
55 |
2011 |
Prakash Bhat |
Senior Vice President and Managing Director, India, since May 2023. Previously he served Vice President and Managing Director, India, from March 2017 to May 2023. |
61 |
2017 |
Don DeMarinis |
Senior Vice President, Sales - Americas & EMEA, since January 2021. Previously he served as Senior Vice President Sales, Americas from January 2018 to December 2020. |
59 |
2018 |
Jeba Kingsley |
Senior Vice President, Professional Services since May 2023. Previously he served as Vice President, Professional Services from December 2018 to May 2023. |
51 |
2018 |
Rohith Kori |
Senior Vice President, Corporate and Product Strategy, since May 2023. Previously he served as Vice President, Corporate and Product Strategy, from June 2020 to May 2023, and Senior Director, Corporate and Product Strategy from May 2019 to May 2020. |
44 |
2020 |
Sridhar Laveti |
Senior Vice President of Product Engineering and Customer Support since June 2020. Previously he served as Vice President of Established Products and Customer Support from September 2017 to June 2020. |
56 |
2017 |
Terrie O’Hanlon |
Senior Vice President, Chief Marketing Officer, since May 2023. Previously she served as Vice President, Chief Marketing Officer, from March 2022 to May 2023. Prior to Agilysys, she served as Chief Marketing Officer at GreyOrange from March 2019 to March 2022. |
62 |
2022 |
Frank Pitsikalis |
Senior Vice President, Strategy, since May 2023. Previously he served as Vice President, Strategy, from January 2022 to May 2023. Prior to Agilysys, he was the Founder and Chief Executive Officer at ResortSuite from September 2000 to January 2022. |
56 |
2022 |
Chris Robertson |
Vice President, Corporate Controller and Treasurer, since June 2019. Previously he served as Corporate Controller and Treasurer from June 2017 to June 2019. |
53 |
2017 |
Sethuram Shivashankar |
Senior Vice President, Chief Technology Officer and Chief Information Officer, since July 2023. Previously he served as Senior Vice President, Chief Information Officer from March 2022 to July 2023, and Vice President, Special Projects, from January 2022 to March 2022. Prior to Agilysys, he served as Senior Vice President, Gaming Systems at Scientific Games from October 2018 to April 2021. |
54 |
2022 |
William David (“Dave”) Wood III |
Senior Vice President and Chief Financial Officer since June 2020. Previously he served as Vice President – Corporate Strategy & Investor Relations from June 2019 to May 2020, and Vice President – Finance from June 2017 to June 2019. |
46 |
2020 |
There are no family relationships among the executive officers or directors of the Company.
26
Part II
Item 5. Market for Registrant’s Common Equity, Related Shareholder Matters and Issuer Purchases of Equity Securities.
Market Information
Our common shares, without par value, are traded on the NASDAQ Global Select Market under the symbol “AGYS”. As of May 17, 2024, there were 1,059 registered holders of our common shares, without par value.
Dividends
We did not pay dividends in fiscal 2024 or 2023 on our common stock and are unlikely to do so in the foreseeable future. The current practice of the Board of Directors is to retain any available earnings for use in the operations and growth of our business, both organically and through acquisitions.
Shareholder Return Performance Presentation
The following chart compares the value of $100 invested in our common shares, including reinvestment of dividends, with a similar investment in the Russell 2000 Index (the “Russell 2000”) and with the companies listed in the SIC Code 7373-Computer Integrated Systems Design for the period March 31, 2019 through March 31, 2024. The stock price performance in this graph is not necessarily indicative of the future performance of our common shares.
Comparison of 5 Year Cumulative Total Return
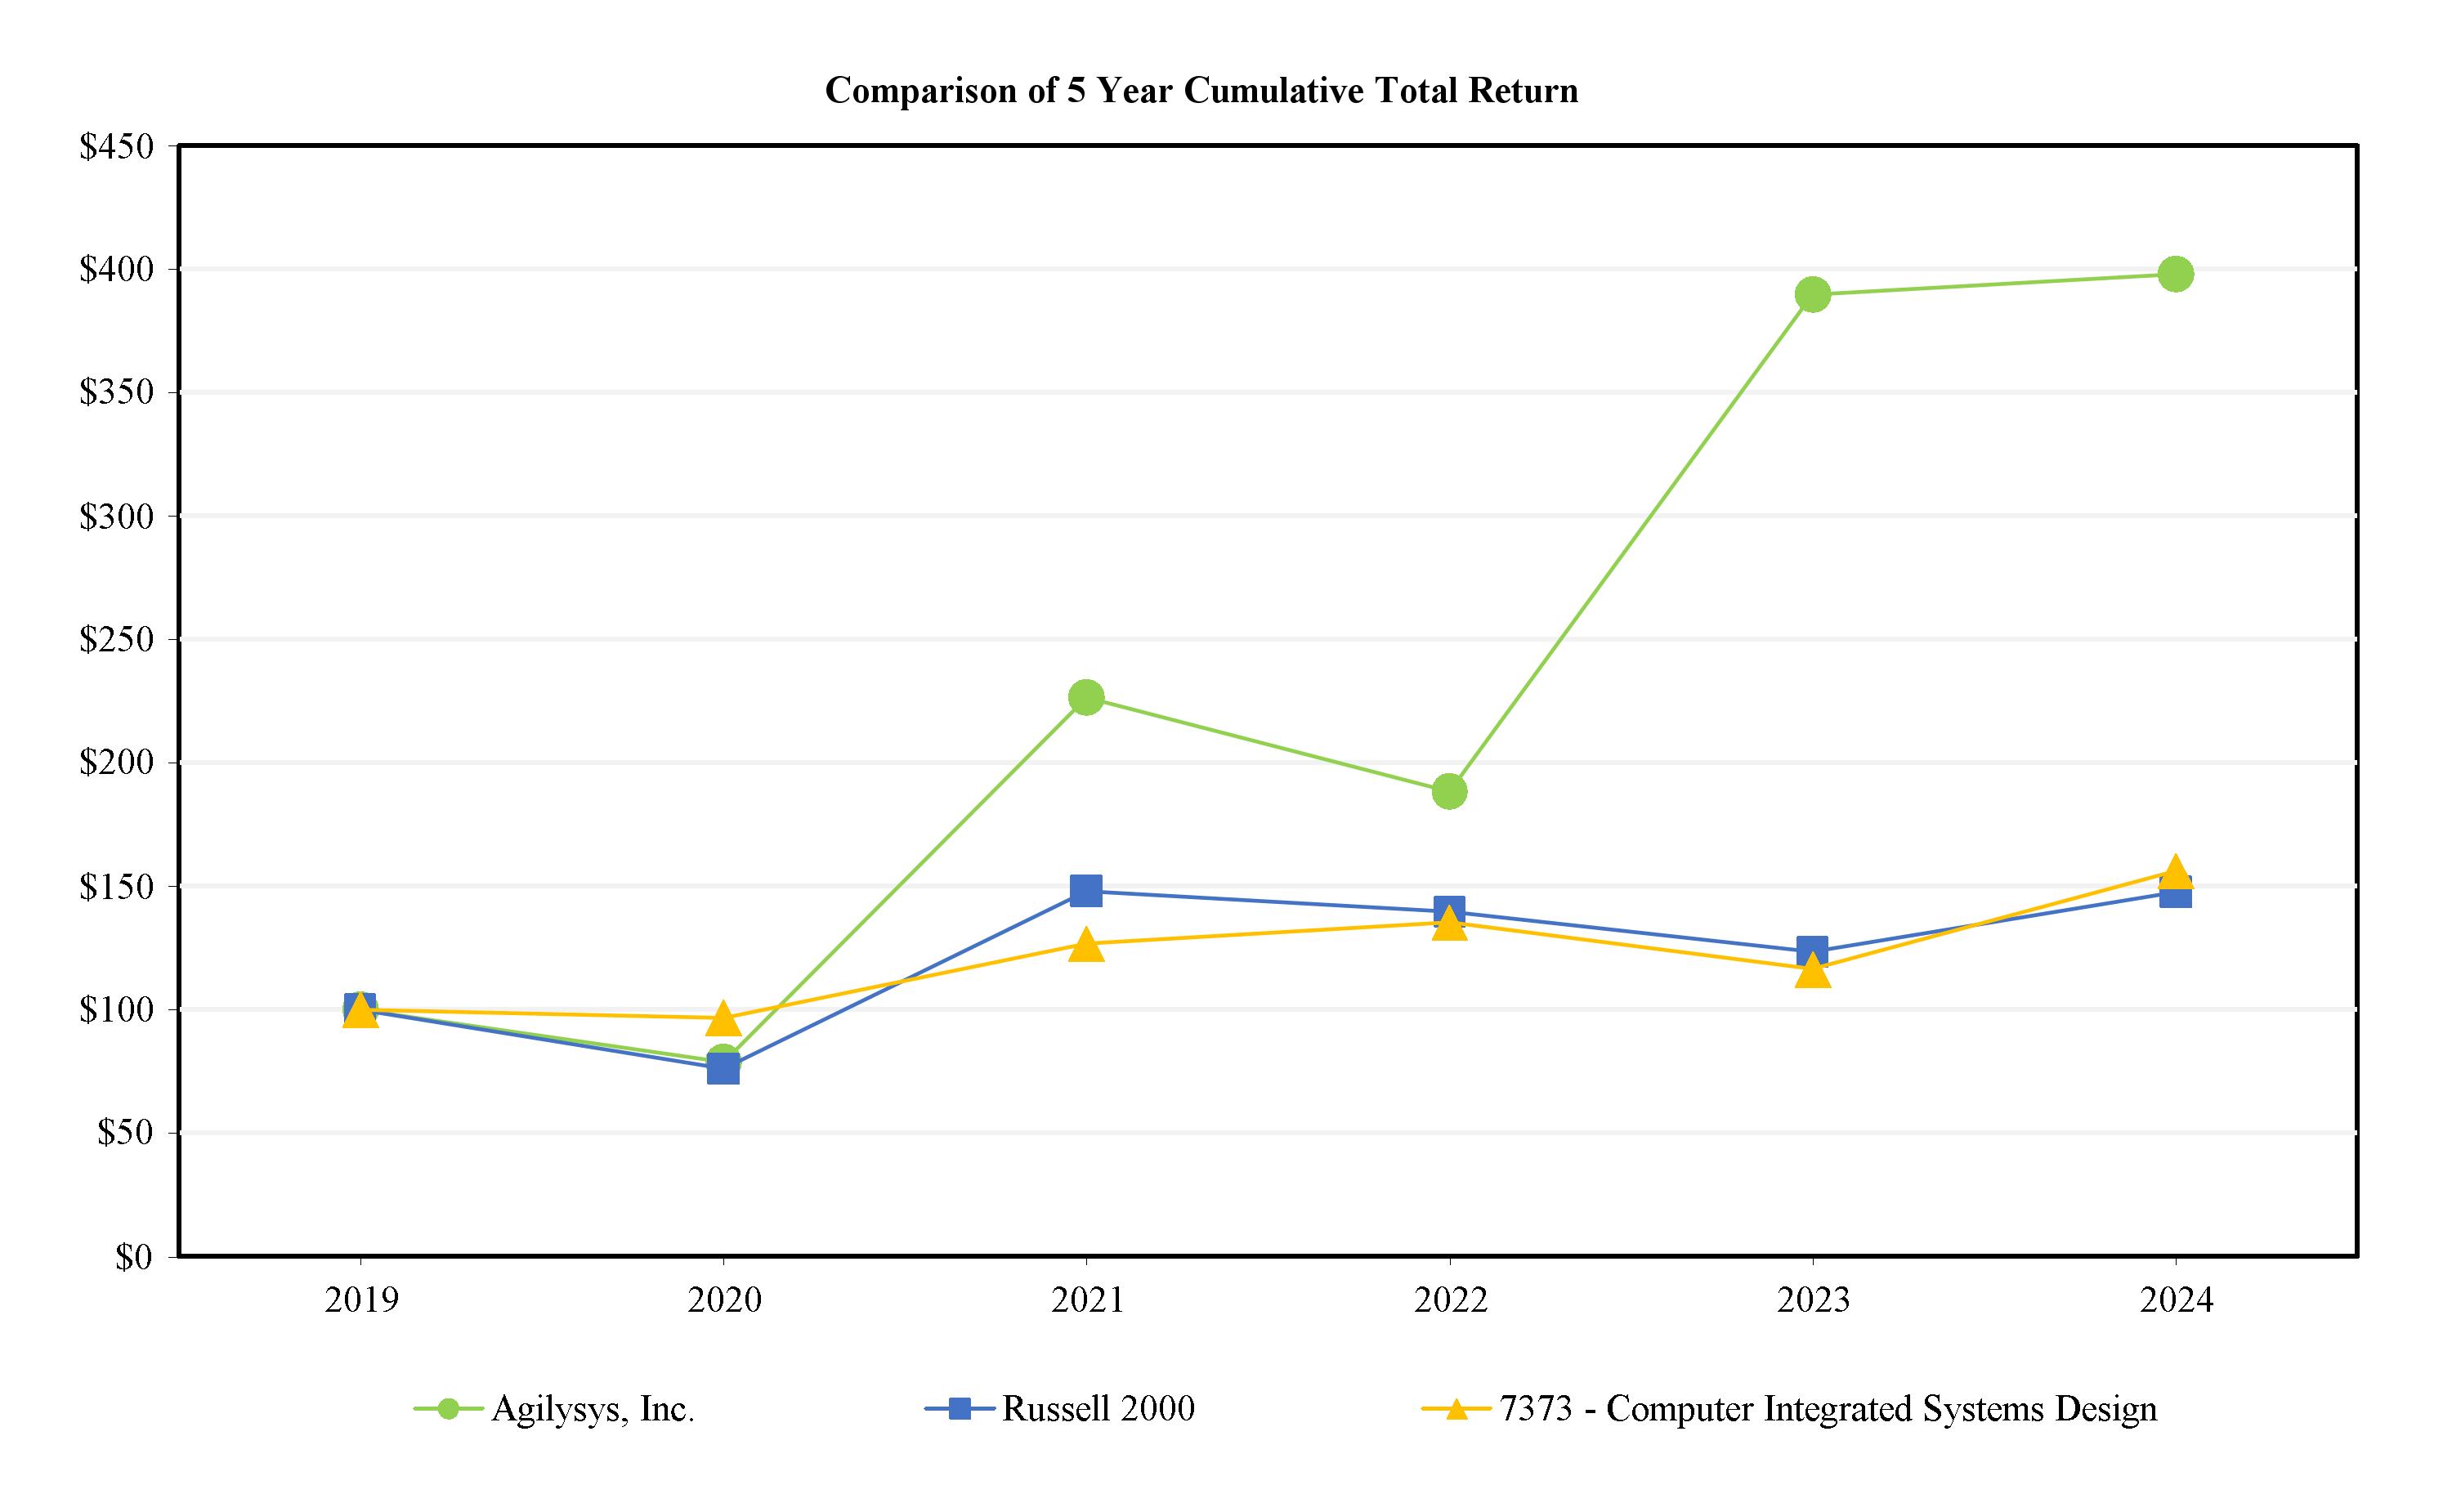
INDEXED RETURNS
27
|
|
|
|
|
Fiscal Years Ended March 31, |
|
||||||||||||||||||
|
|
Base Period |
|
|
|
|
|
|
|
|
|
|
|
|
|
|
|
|
||||||
Company Name / Index |
|
2019 |
|
|
2020 |
|
|
2021 |
|
|
2022 |
|
|
2023 |
|
|
2024 |
|
||||||
Agilysys, Inc. |
|
$ |
100.00 |
|
|
$ |
78.89 |
|
|
$ |
226.55 |
|
|
$ |
188.38 |
|
|
$ |
389.70 |
|
|
$ |
397.92 |
|
Russell 2000 |
|
$ |
100.00 |
|
|
$ |
76.01 |
|
|
$ |
148.10 |
|
|
$ |
139.53 |
|
|
$ |
123.34 |
|
|
$ |
147.65 |
|
Peer Group |
|
$ |
100.00 |
|
|
$ |
96.67 |
|
|
$ |
126.72 |
|
|
$ |
135.34 |
|
|
$ |
116.39 |
|
|
$ |
156.20 |
|
This performance graph shall not be deemed “filed” for purposes of Section 18 of the Securities Exchange Act of 1934, as amended or incorporated by reference into any of our filings under the Securities Act of 1933, as amended, of the Exchange Act, except as shall be expressly set forth by specific reference in such filing.
Item 6. [Reserved]
28
Item 7. Managements’ Discussion and Analysis of Financial Condition and Results of Operations.
In “Management’s Discussion and Analysis of Financial Condition and Results of Operations” (“MD&A”), management explains the general financial condition and results of operations for Agilysys and subsidiaries including:
— what factors affect our business;
— what our earnings and costs were;
— why those earnings and costs were different from the year before;
— where the earnings came from;
— how our financial condition was affected; and
— where the cash will come from to fund future operations.
The MD&A analyzes changes in specific line items in the Consolidated Statements of Operations and Consolidated Statements of Cash Flows and provides information that management believes is important to assessing and understanding our consolidated financial condition and results of operations. This discussion should be read in conjunction with the Consolidated Financial Statements and related Notes that appear in Item 8 of this Annual Report titled, “Financial Statements and Supplementary Data.” Information provided in the MD&A may include forward-looking statements that involve risks and uncertainties. Many factors could cause actual results to be materially different from those contained in the forward-looking statements. See “Forward-Looking Information” on page 3 of this Annual Report and Item 1A “Risk Factors” in Part I of this Annual Report for additional information concerning these items. Management believes that this information, discussion, and disclosure is important in making decisions about investing in Agilysys.
Overview
Recent Developments
Macroeconomic Conditions
During the year ended March 31, 2024, global macroeconomic conditions were, and continue to be, influenced by a number of factors, including, but not limited to, political unrest, armed conflicts, labor shortages and natural disasters. We believe such conditions are impacting customer spending and provider pricing decisions resulting in decreased demand, increased costs, and reduced margins particularly in areas outside of the United States.
Our Business
Agilysys has been a leader in hospitality software for more than 45 years, delivering innovative state-of-the-art cloud-native SaaS and on-premise guest-centric technology solutions. Customers around the world include: branded and independent hotels; multi-amenity resort properties; casinos; property, hotel and resort management companies; cruise lines; corporate dining providers; higher education campus dining providers; food service management companies; hospitals; lifestyle communities; senior living facilities; stadiums; and theme parks. Agilysys offers the most comprehensive software solutions in the industry, including point-of-sale (POS), property management (PMS), inventory and procurement, payments, and related applications, to manage the entire guest journey. Agilysys is also known for its world class customer-centric service. Some of the largest hospitality companies around the world use Agilysys solutions to help improve guest loyalty, drive revenue growth and increase operational efficiencies.
The Company has just one reportable segment serving the global hospitality industry. Agilysys operates across North America, Europe, the Middle East, Asia-Pacific, and India, with headquarters located in Alpharetta, Georgia.
Our top priority is increasing shareholder value by improving operating and financial performance and profitably growing the business through superior products and services. To that end, we expect to invest a certain portion of our cash on hand to fund enhancements to existing software products, to develop and market new software products, and to expand our customer breadth, both vertically and geographically.
Our strategic plan specifically focuses on:
29
The primary objective of our ongoing strategic planning process is to create shareholder value by capitalizing on growth opportunities, increasing profitability and strengthening our competitive position within the specific technology solutions and end markets we serve. Profitability and industry-leading growth will be achieved through tighter management of operating expenses and sharpening the focus of our investments to concentrate on growth opportunities that offer the highest returns.
Revenue – Defined
As required by the SEC, we separately present revenue earned as products revenue, subscription and maintenance revenue or professional services revenue in our Consolidated Statements of Operations. In addition to the SEC requirements, we may, at times, also refer to revenue as defined below. The terminology, definitions, and applications of terms we use to describe our revenue may be different from those used by other companies and caution should be used when comparing these financial measures to those of other companies. We use the following terms to describe revenue:
30
Results of Operations
Fiscal 2024 Compared to Fiscal 2023
Net Revenue and Operating Income
The following table presents our consolidated revenue and operating results for the fiscal years ended March 31, 2024 and 2023:
|
|
Year ended March 31, |
|
|
Increase (decrease) |
|
||||||||||
(Dollars in thousands) |
|
2024 |
|
|
2023 |
|
|
$ |
|
|
% |
|
||||
Net revenue: |
|
|
|
|
|
|
|
|
|
|
|
|
||||
Products |
|
$ |
49,083 |
|
|
$ |
43,638 |
|
|
$ |
5,445 |
|
|
|
12.5 |
% |
Subscription and maintenance |
|
|
138,069 |
|
|
|
118,285 |
|
|
|
19,784 |
|
|
|
16.7 |
% |
Professional services |
|
|
50,312 |
|
|
|
36,142 |
|
|
|
14,170 |
|
|
|
39.2 |
% |
Total net revenue |
|
|
237,464 |
|
|
|
198,065 |
|
|
|
39,399 |
|
|
|
19.9 |
% |
Cost of goods sold: |
|
|
|
|
|
|
|
|
|
|
|
|
||||
Products |
|
|
26,318 |
|
|
|
22,994 |
|
|
|
3,324 |
|
|
|
14.5 |
% |
Subscription and maintenance |
|
|
30,870 |
|
|
|
26,262 |
|
|
|
4,608 |
|
|
|
17.5 |
% |
Professional services |
|
|
36,020 |
|
|
|
27,990 |
|
|
|
8,030 |
|
|
|
28.7 |
% |
Total cost of goods sold |
|
|
93,208 |
|
|
|
77,246 |
|
|
|
15,962 |
|
|
|
20.7 |
% |
Gross profit |
|
$ |
144,256 |
|
|
$ |
120,819 |
|
|
$ |
23,437 |
|
|
|
19.4 |
% |
Gross profit margin |
|
|
60.7 |
% |
|
|
61.0 |
% |
|
|
|
|
|
|
||
Operating expenses: |
|
|
|
|
|
|
|
|
|
|
|
|
||||
Product development |
|
$ |
56,739 |
|
|
$ |
50,260 |
|
|
$ |
6,479 |
|
|
|
12.9 |
% |
Sales and marketing |
|
|
28,439 |
|
|
|
22,716 |
|
|
|
5,723 |
|
|
|
25.2 |
% |
General and administrative |
|
|
36,279 |
|
|
|
30,669 |
|
|
|
5,610 |
|
|
|
18.3 |
% |
Depreciation of fixed assets |
|
|
3,896 |
|
|
|
1,769 |
|
|
|
2,127 |
|
|
|
120.2 |
% |
Amortization of internal-use software and intangibles |
|
|
1,366 |
|
|
|
1,743 |
|
|
|
(377 |
) |
|
|
(21.6 |
)% |
Other charges, net |
|
|
1,756 |
|
|
|
435 |
|
|
|
1,321 |
|
|
|
303.7 |
% |
Legal settlements |
|
|
28 |
|
|
|
352 |
|
|
|
(324 |
) |
|
nm |
|
|
Operating income |
|
$ |
15,753 |
|
|
$ |
12,875 |
|
|
$ |
2,878 |
|
|
|
22.4 |
% |
Operating income percentage |
|
|
6.6 |
% |
|
|
6.5 |
% |
|
|
|
|
|
|
||
nm - not meaningful
31
The following table presents the percentage relationship of our Consolidated Statement of Operations line items to our consolidated net revenues for the periods presented:
|
|
Year ended March 31, |
|
|||||
|
|
2024 |
|
|
2023 |
|
||
Net revenue: |
|
|
|
|
|
|
||
Products |
|
|
20.7 |
% |
|
|
22.1 |
% |
Subscription and maintenance |
|
|
58.1 |
|
|
|
59.7 |
|
Professional services |
|
|
21.2 |
|
|
|
18.2 |
|
Total net revenue |
|
|
100.0 |
% |
|
|
100.0 |
% |
Cost of goods sold: |
|
|
|
|
|
|
||
Products |
|
|
11.1 |
% |
|
|
11.6 |
% |
Subscription and maintenance |
|
|
13.0 |
|
|
|
13.3 |
|
Professional services |
|
|
15.2 |
|
|
|
14.1 |
|
Total cost of goods sold |
|
|
39.3 |
% |
|
|
39.0 |
% |
Gross profit |
|
|
60.7 |
% |
|
|
61.0 |
% |
Operating expenses: |
|
|
|
|
|
|
||
Product development |
|
|
23.9 |
% |
|
|
25.3 |
% |
Sales and marketing |
|
|
12.0 |
|
|
|
11.5 |
|
General and administrative |
|
|
15.3 |
|
|
|
15.5 |
|
Depreciation of fixed assets |
|
|
1.6 |
|
|
|
0.9 |
|
Amortization of internal-use software and intangibles |
|
|
0.6 |
|
|
|
0.9 |
|
Other charges, net |
|
|
0.7 |
|
|
|
0.2 |
|
Legal settlements |
|
|
0.0 |
|
|
|
0.2 |
|
Operating income |
|
|
6.6 |
% |
|
|
6.5 |
% |
Net revenue. Total revenue increased $39.4 million, or 19.9%, in fiscal 2024 compared to fiscal 2023. Products revenue increased $5.4 million, or 12.5%, due to higher sales and deliveries to new customers and expansion with existing customers. Subscription and maintenance revenue increased $19.8 million, or 16.7%, driven by continued growth in subscription-based revenue, which increased 29.6% in fiscal 2024 compared to fiscal 2023. Professional services revenue increased $14.2 million, or 39.2%, due to higher sales and service activity as our new and existing customers continue implementing technology to improve their operations.
Gross profit and gross profit margin. Our total gross profit increased $23.4 million, or 19.4%, in fiscal 2024 and total gross profit margin decreased from 61.0% to 60.7% compared to fiscal 2023 driven by changes in the composition of revenue by category. Products gross profit increased $2.1 million and gross profit margin decreased from 47.3% to 46.4% due to the composition of hardware products delivered. Subscription and maintenance gross profit increased $15.2 million and gross profit margin decreased from 77.8% to 77.6% as certain variable costs increased ahead of related revenue. Professional services gross profit increased $6.1 million and gross profit margin increased from 22.6% to 28.4% reflecting improved utilization rates from efficiency gains on multi-solution implementations.
Operating expenses
Operating expenses, excluding the charges for legal settlements and other charges, increased $19.6 million, or 18.3%, in fiscal 2024 compared with fiscal 2023. As a percent of total revenue, operating expenses have decreased 0.7% in fiscal 2024 compared with fiscal 2023.
Product development. Product development includes all expenses associated with research and development. Product development increased $6.5 million, or 12.9%, during fiscal 2024 as compared to fiscal 2023 due to hiring and increased compensation rates across our development teams, increased travel, and higher rent.
32
Sales and marketing. Sales and marketing increased $5.7 million, or 25.2%, in fiscal 2024 compared with fiscal 2023 due to hiring and increased salary, incentive and employee benefits rates across our sales and marketing teams, and continued expansion of marketing event and trade show activity.
General and administrative. General and administrative increased $5.6 million, or 18.3%, in fiscal 2024 compared to fiscal 2023 due to investments in our information security infrastructure along with hiring and increased compensation rates across our administrative teams, increased travel, and higher subscription charges for cloud computing arrangements.
Depreciation of fixed assets. Depreciation of fixed assets increased $2.1 million or 120.2% in fiscal 2024 as compared to fiscal 2023 due significant capital expenditures over the last two fiscal years to build out new office space leases and to properly equip growing teams across the Company.
Amortization of internal-use software and intangibles. Amortization of internal-use software and intangibles decreased $0.4 million or 21.6% in fiscal 2024 as compared to fiscal 2023 due to the full amortization of certain intangible assets.
Other charges, net. Other charges, net increased $1.3 million due to a significant increase in severance charges, common stock registration costs and certain compliance costs during fiscal 2024 compared to fiscal 2023.
Legal settlements. Legal settlements decreased $0.3 million during fiscal 2024 compared to fiscal 2023 due to a decrease in settlements of employment and other business-related matters.
Other Income (Expenses)
|
|
Year ended March 31, |
|
|
Favorable (unfavorable) |
|
||||||||||
(Dollars in thousands) |
|
2024 |
|
|
2023 |
|
|
$ |
|
|
% |
|
||||
Other income (expense): |
|
|
|
|
|
|
|
|
|
|
|
|
||||
Interest income |
|
$ |
5,083 |
|
|
$ |
2,192 |
|
|
$ |
2,891 |
|
|
|
131.9 |
% |
Other (expense) income, net |
|
|
(152 |
) |
|
|
697 |
|
|
|
(849 |
) |
|
nm |
|
|
Total other income, net |
|
$ |
4,931 |
|
|
$ |
2,889 |
|
|
$ |
2,042 |
|
|
|
70.7 |
% |
nm – not meaningful
Interest income. Interest income consists of interest earned on cash equivalents including short-term investments in commercial paper, treasury bills and money market funds.
Other (expense) income, net. Other (expense) income, net mainly consists of movement of foreign currencies against the U.S. dollar.
Income Taxes
|
|
Year ended March 31, |
|
|
Favorable |
|||||||||
(Dollars in thousands) |
|
2024 |
|
|
2023 |
|
|
$ |
|
|
% |
|||
Income tax (benefit) provision |
|
$ |
(65,511 |
) |
|
$ |
1,182 |
|
|
$ |
(66,693 |
) |
|
nm |
Effective tax rate |
|
nm |
|
|
|
7.5 |
% |
|
|
|
|
|
||
nm – not meaningful
For fiscal 2024, the effective tax rate was different than the statutory rate due primarily to the release of valuation allowances recorded against U.S. Federal and certain State deferred tax assets, consisting primarily of Net Operating Losses.
We are consistently subject to tax audits. Due to the nature of examinations in multiple jurisdictions, changes could occur in the amount of gross unrecognized tax benefits during the next 12 months that we cannot anticipate.
The ultimate realization of deferred tax assets depends on various factors including the generation of taxable income during the future periods in which the underlying temporary differences are deductible. As of March 31, 2024, we had $78.5 million of federal net operating loss carryforwards that expire, if unused, in fiscal years 2033 to 2039, and $42.5 million of federal net operating loss carryforwards that can be carried forward indefinitely. We also had $111.8 million of state net operating loss carryforwards that expire, if unused, in fiscal years 2025 through 2043. We maintain valuation allowances for deferred tax assets until we have sufficient
33
evidence to support the reversal of all or some portion of the allowances. Based on recent earnings and anticipated future earnings, we released a significant portion of the valuation allowances previously maintained against our deferred tax assets.
Fiscal 2023 Compared to Fiscal 2022
Net Revenue and Operating Income
The following table presents our consolidated revenue and operating results for the fiscal years ended March 31, 2023 and 2022:
|
|
Year ended March 31, |
|
|
Increase (decrease) |
|
||||||||||
(Dollars in thousands) |
|
2023 |
|
|
2022 |
|
|
$ |
|
|
% |
|
||||
Net revenue: |
|
|
|
|
|
|
|
|
|
|
|
|
||||
Products |
|
$ |
43,638 |
|
|
$ |
35,956 |
|
|
$ |
7,682 |
|
|
|
21.4 |
% |
Subscription and maintenance |
|
|
118,285 |
|
|
|
98,958 |
|
|
|
19,327 |
|
|
|
19.5 |
% |
Professional services |
|
|
36,142 |
|
|
|
27,722 |
|
|
|
8,420 |
|
|
|
30.4 |
% |
Total net revenue |
|
|
198,065 |
|
|
|
162,636 |
|
|
|
35,429 |
|
|
|
21.8 |
% |
Cost of goods sold: |
|
|
|
|
|
|
|
|
|
|
|
|
||||
Products, inclusive of developed technology amortization |
|
|
22,994 |
|
|
|
19,251 |
|
|
|
3,743 |
|
|
|
19.4 |
% |
Subscription and maintenance |
|
|
26,262 |
|
|
|
21,141 |
|
|
|
5,121 |
|
|
|
24.2 |
% |
Professional services |
|
|
27,990 |
|
|
|
20,712 |
|
|
|
7,278 |
|
|
|
35.1 |
% |
Total cost of goods sold |
|
|
77,246 |
|
|
|
61,104 |
|
|
|
16,142 |
|
|
|
26.4 |
% |
Gross profit |
|
$ |
120,819 |
|
|
$ |
101,532 |
|
|
$ |
19,287 |
|
|
|
19.0 |
% |
Gross profit margin |
|
|
61.0 |
% |
|
|
62.4 |
% |
|
|
|
|
|
|
||
Operating expenses: |
|
|
|
|
|
|
|
|
|
|
|
|
||||
Product development |
|
$ |
50,260 |
|
|
$ |
46,332 |
|
|
$ |
3,928 |
|
|
|
8.5 |
% |
Sales and marketing |
|
|
22,716 |
|
|
|
14,730 |
|
|
|
7,986 |
|
|
|
54.2 |
% |
General and administrative |
|
|
30,669 |
|
|
|
27,734 |
|
|
|
2,935 |
|
|
|
10.6 |
% |
Depreciation of fixed assets |
|
|
1,769 |
|
|
|
2,210 |
|
|
|
(441 |
) |
|
|
(20.0 |
)% |
Amortization of internal-use software and intangibles |
|
|
1,743 |
|
|
|
1,654 |
|
|
|
89 |
|
|
|
5.4 |
% |
Other charges, net |
|
|
435 |
|
|
|
1,584 |
|
|
|
(1,149 |
) |
|
nm |
|
|
Legal settlements |
|
|
352 |
|
|
|
969 |
|
|
|
(617 |
) |
|
nm |
|
|
Operating income |
|
$ |
12,875 |
|
|
$ |
6,319 |
|
|
$ |
6,556 |
|
|
nm |
|
|
Operating income percentage |
|
|
6.5 |
% |
|
|
3.9 |
% |
|
|
|
|
|
|
||
34
The following table presents the percentage relationship of our Consolidated Statement of Operations line items to our consolidated net revenues for the periods presented:
|
|
Year ended March 31, |
|
|||||
|
|
2023 |
|
|
2022 |
|
||
Net revenue: |
|
|
|
|
|
|
||
Products |
|
|
22.1 |
% |
|
|
22.1 |
% |
Subscription and maintenance |
|
|
59.7 |
|
|
|
60.8 |
|
Professional services |
|
|
18.2 |
|
|
|
17.1 |
|
Total net revenue |
|
|
100.0 |
% |
|
|
100.0 |
% |
Cost of goods sold: |
|
|
|
|
|
|
||
Products, inclusive of developed technology amortization |
|
|
11.6 |
% |
|
|
11.8 |
% |
Subscription and maintenance |
|
|
13.3 |
|
|
|
13.0 |
|
Professional services |
|
|
14.1 |
|
|
|
12.8 |
|
Total cost of goods sold |
|
|
39.0 |
% |
|
|
37.6 |
% |
Gross profit |
|
|
61.0 |
% |
|
|
62.4 |
% |
Operating expenses: |
|
|
|
|
|
|
||
Product development |
|
|
25.3 |
% |
|
|
28.4 |
% |
Sales and marketing |
|
|
11.5 |
|
|
|
9.1 |
|
General and administrative |
|
|
15.5 |
|
|
|
17.1 |
|
Depreciation of fixed assets |
|
|
0.9 |
|
|
|
1.4 |
|
Amortization of internal-use software and intangibles |
|
|
0.9 |
|
|
|
1.0 |
|
Other charges, net |
|
|
0.2 |
|
|
|
1.0 |
|
Legal settlements |
|
|
0.2 |
|
|
|
0.5 |
|
Operating income |
|
|
6.5 |
% |
|
|
3.9 |
% |
Net revenue. Total revenue increased $35.4 million, or 21.8%, in fiscal 2023 compared to fiscal 2022. Products revenue increased $7.7 million, or 21.4%, due to higher sales and deliveries to new customers and expansion with existing customers. Subscription and maintenance revenue increased $19.3 million, or 19.5%, driven by continued growth in subscription-based revenue, which increased 27.5% in fiscal 2023 compared to fiscal 2022. Professional services revenue increased $8.4 million, or 30.4%, due to higher sales and service activity as our new and existing customers continue implementing technology to improve their operations.
Gross profit and gross profit margin. Our total gross profit increased $19.3 million, or 19.0%, in fiscal 2023 and total gross profit margin decreased from 62.4% to 61.0%. Products gross profit increased $3.9 million and gross profit margin increased from 46.5% to 47.3% due to a higher proportion of proprietary software revenue over third-party products. Subscription and maintenance gross profit increased $14.2 million and gross profit margin decreased from 78.6% to 77.8% as certain variable costs increased ahead of related revenue. Professional services gross profit increased $1.1 million and gross profit margin decreased from 25.3% to 22.6% reflecting lower utilization rates due to higher non-billable hours on new, more complex solution implementations over the comparable annual periods.
Operating expenses
Operating expenses, excluding the charges for legal settlements and other charges, increased $14.5 million, or 15.6%, in fiscal 2023 compared with fiscal 2022. As a percent of total revenue, operating expenses have decreased 2.9% in fiscal 2023 compared with fiscal 2022.
Product development. Product development includes all expenses associated with research and development. Product development increased $3.9 million, or 8.5%, during fiscal 2023 as compared to fiscal 2022 due to hiring and higher salary and incentive rates across our development teams, increased travel, and higher subscription charges for cloud computing arrangements.
35
Sales and marketing. Sales and marketing increased $8.0 million, or 54.2%, in fiscal 2023 compared with fiscal 2022 due to various sales and marketing investments including several key hires, significantly higher levels of marketing event and trade show activity and increased commission expense on higher sales levels.
General and administrative. General and administrative increased $2.9 million, or 10.6%, in fiscal 2023 compared to fiscal 2022 due to investments in our information security and information technology infrastructure along with hiring and increased salary and incentive rates across our administrative teams, higher rent, increased travel, and higher subscription charges for cloud computing arrangements.
Depreciation of fixed assets. Depreciation of fixed assets decreased $0.4 million or 20.0% in fiscal 2023 as compared to fiscal 2022 due to an increased level of assets with shorter useful lives.
Amortization of internal-use software and intangibles. Amortization of internal-use software and intangibles increased $0.1 million or 5.4% in fiscal 2023 as compared to fiscal 2022 due to the addition of certain intangible assets that began amortizing in January 2022 subsequent to the acquisition of ResortSuite Inc. (ResortSuite) as described in Note 15, Business Combination, to our Consolidated Financial Statements under Item 8 of this Annual Report.
Other charges, net. Other charges, net decreased $1.1 million due to a significant reduction in non-recurring charges including ResortSuite acquisition costs during fiscal 2023 compared to fiscal 2022.
Legal settlements. Legal settlements decreased $0.6 million during fiscal 2023 compared to fiscal 2022 due to a decrease in settlements of employment and other business-related matters.
Other Income (Expenses)
|
|
Year ended March 31, |
|
|
Favorable (unfavorable) |
|||||||||
(Dollars in thousands) |
|
|
2023 |
|
|
|
2022 |
|
|
$ |
|
|
% |
|
Other income (expense): |
|
|
|
|
|
|
|
|
|
|
|
|||
Interest income |
|
$ |
2,192 |
|
|
$ |
59 |
|
|
$ |
2,133 |
|
|
nm |
Interest (expense) |
|
|
— |
|
|
|
(12 |
) |
|
|
12 |
|
|
nm |
Other income (expense), net |
|
|
697 |
|
|
|
145 |
|
|
|
552 |
|
|
nm |
Total other income (expense), net |
|
$ |
2,889 |
|
|
$ |
192 |
|
|
$ |
2,697 |
|
|
nm |
nm – not meaningful
Interest income. Interest income consists of interest earned on cash equivalents including short-term investments in commercial paper, treasury bills and money market funds.
Interest (expense). Interest expense consists of costs associated with finance leases.
Other income (expense), net. Other income (expense), net mainly consists of movement of foreign currencies against the U.S. dollar.
Income Taxes
|
|
Year ended March 31, |
|
|
Unfavorable |
|||||||||
(Dollars in thousands) |
|
2023 |
|
|
2022 |
|
|
$ |
|
|
% |
|||
Income tax expense |
|
$ |
1,182 |
|
|
$ |
33 |
|
|
$ |
1,149 |
|
|
nm |
Effective tax rate |
|
|
7.5 |
% |
|
|
0.5 |
% |
|
|
|
|
|
|
nm – not meaningful
For fiscal 2023, the effective tax rate was different than the statutory rate due primarily to adjustments to deferred tax assets including decreases in valuation allowances that reduce deferred tax assets.
We are consistently subject to tax audits. Due to the nature of examinations in multiple jurisdictions, changes could occur in the amount of gross unrecognized tax benefits during the next 12 months that we cannot anticipate. Although the timing and outcome of tax settlements remain uncertain, we expect that, as a result of the expiration of various statutes of limitations, a reduction in unrecognized tax benefits including related penalties and interest is more likely than not to occur during the next 12 months.
36
Because of our losses in prior periods, we have recorded a valuation allowance offsetting substantially all of the Company's deferred tax assets. The ultimate realization of deferred tax assets depends on various factors including the generation of taxable income during the future periods in which the underlying temporary differences are deductible. As of March 31, 2023, we had $132.0 million of federal net operating loss carryforwards that expire, if unused, in fiscal years 2033 to 2039, and $43.8 million of federal net operating loss carryforwards that can be carried forward indefinitely. We also had $133.9 million of state net operating loss carryforwards that expire, if unused, in fiscal years 2024 through 2042. We maintain valuation allowances for deferred tax assets until we have sufficient evidence to support the reversal of all or some portion of the allowances. Based on recent earnings and anticipated future earnings, we believe it is reasonably possible that within the next 12 months we will have sufficient positive evidence to conclude that a significant portion of our valuation allowances will no longer be needed. Releasing the valuation allowances would result in the recognition of certain deferred tax assets and significant income tax benefits.
Liquidity and Capital Resources
Overview
Our cash requirements consist primarily of working capital needs, capital expenditures, and payments of contractual obligations. Our contractual obligations consist primarily of operating leases for office space. We disclose our lease obligations in Note 6, Leases, to our Consolidated Financial Statements included under Item 8 of this Annual Report.
At March 31, 2024, 100% of our cash and cash equivalents, of which 95% were held in the United States, were deposited in bank accounts or invested in highly liquid investments including commercial paper and treasury bills with original maturity from the date of acquisition of three months or less and money market funds. Certain bank account balances may exceed federally insured limits. We determine the fair value of commercial paper using significant other observable inputs based on pricing from independent sources that use quoted prices in active markets for identical assets or other observable inputs including benchmark yields and interest rates. We believe credit risk is limited with respect to our cash and cash equivalents.
We believe that cash flow from operating activities, cash on hand of $144.9 million as of March 31, 2024, and access to capital markets will provide adequate funds to meet our liquidity requirements for at least the next twelve months, as well as our long-term liquidity requirements.
Cash Flow
|
|
Year ended March 31, |
|
|||||||||
(In thousands) |
|
|
2024 |
|
|
|
2023 |
|
|
|
2022 |
|
Net cash provided by (used in): |
|
|
|
|
|
|
|
|
|
|||
Operating activities |
|
$ |
48,186 |
|
|
$ |
34,463 |
|
|
$ |
28,475 |
|
Investing activities |
|
|
(7,602 |
) |
|
|
(6,870 |
) |
|
|
(25,679 |
) |
Financing activities |
|
|
(8,558 |
) |
|
|
(11,094 |
) |
|
|
(4,901 |
) |
Effect of exchange rate changes on cash |
|
|
23 |
|
|
|
(628 |
) |
|
|
(104 |
) |
Increase (decrease) in cash |
|
$ |
32,049 |
|
|
$ |
15,871 |
|
|
$ |
(2,209 |
) |
Cash flow provided by operating activities. Cash flows provided by operating activities were $48.2 million in fiscal 2024. The provision of cash was due primarily to our net income of $86.2 million adjusted for $48.1 million in non-cash expense including depreciation, amortization, share-based compensation, deferred income taxes, gains on asset disposals and an increase of $10.1 million from the changes in operating assets and liabilities.
Cash flows provided by operating activities were $34.5 million in fiscal 2023. The provision of cash was due primarily to our net income of $14.6 million adjusted for $16.4 million in non-cash expense including depreciation, amortization, and share-based compensation and an increase of $3.5 million from the changes in operating assets and liabilities.
Cash flows provided by operating activities were $28.5 million in fiscal 2022. The provision of cash was due primarily to our net income of $6.5 million adjusted for $17.7 million in non-cash expense including depreciation, amortization, and share-based compensation and an increase of $4.3 million from the changes in operating assets and liabilities.
Cash flow used in investing activities. Cash flows used in investing activities in fiscal 2024 were $7.6 million due to $8.1 million in purchases of property and equipment, including internal use software and $0.5 million in cash received from the sale of fixed assets located at our India research and development center.
37
Cash flows used in investing activities in fiscal 2023 were $6.9 million due to $7.3 million in purchases of property and equipment, including internal use software and $0.4 million in cash received from final working capital adjustments related to the ResortSuite acquisition.
Cash flows used in investing activities in fiscal 2022 were $25.7 million due to $24.5 million in cash paid for business combinations, net of cash acquired, and $1.2 million in purchases of property and equipment, including internal use software.
Cash flow used in financing activities. Cash flows used in financing activities in fiscal 2024 were $8.6 million due to share repurchases of $6.9 million to satisfy employee tax withholding on share-based compensation, and $1.7 million in preferred stock dividends.
Cash flows used in financing activities in fiscal 2023 were $11.1 million due to share repurchases of $9.3 million to satisfy employee tax withholding on share-based compensation and $1.8 million in preferred stock dividends.
Cash flows used in financing activities in fiscal 2022 were $4.9 million and primarily comprised of share repurchases of $3.0 million to satisfy employee tax withholding on share-based compensation and $1.8 million in preferred stock dividends.
Investments
Investments in Corporate-Owned Life Insurance Policies
Agilysys invests in corporate-owned life insurance policies for certain former executives, for which some are endorsement split-dollar life insurance arrangements. We entered into agreements with each of the former executives, whereby we must maintain the life insurance policy for a specified amount and split a portion of the policy benefits with their designated beneficiary. Our investment in these corporate-owned life insurance policies were recorded at their cash surrender value, which approximates fair value at the balance sheet date. In the Consolidated Balance Sheets at the balance sheet date, the cash surrender value of $1.0 million for the remaining policies were held in “Other non-current assets,” and the present value of future proceeds owed to those executives’ designated beneficiary of $0.1 million, which approximates fair value, were recorded within “Other non-current liabilities” in the Consolidated Balance Sheets at the balance sheet date.
Off-Balance Sheet Arrangements
We have not entered into any off-balance sheet arrangements that have had or are reasonably likely to have a current or future effect on our financial condition, changes in financial condition, revenues or expenses, results of operations, liquidity, capital expenditures, or capital resources.
Critical Accounting Policies
Managements’ Discussion and Analysis is based upon our Consolidated Financial Statements, which have been prepared in accordance with U.S. generally accepted accounting principles. The preparation of these financial statements requires us to make significant estimates and judgments that affect the reported amounts of assets, liabilities, revenue, and expenses and related disclosure of contingent assets and liabilities. We regularly evaluate our estimates, including those related to bad debts, inventories, investments, intangible assets, income taxes, restructuring, contingencies and litigation. We base our estimates on historical experience and on various other assumptions that we believe to be reasonable under the circumstances, the results of which form the basis for making judgments about the carrying values of assets and liabilities that are not readily apparent from other sources.
Our most significant accounting policies relate to the sale, purchase, and promotion of our products and services. The policies discussed below are considered by management to be critical to an understanding of our Consolidated Financial Statements because their application places the most significant demands on management’s judgment, with financial reporting results relying on estimation about the effect of matters that are inherently uncertain. Specific risks for these critical accounting policies are described in the following paragraphs.
For all these policies, management cautions that future events rarely develop exactly as forecasted, and the best estimates routinely require adjustment.
Revenue recognition. Our customary business practice is to enter into legally enforceable written contracts with our customers. The majority of our contracts are governed by a master service agreement between us and the customer, which sets forth the general terms and conditions of any individual contract between the parties, which is then supplemented by a customer order to specify the different
38
goods and services, the associated prices, and any additional terms for an individual contract. Performance obligations specific to each individual contract are defined within the terms of each order. Each performance obligation is identified based on the goods and services that will be transferred to our customer that are both capable of being distinct and are distinct within the context of the contract. The transaction price is determined based on the consideration to which we will be entitled and expect to receive in exchange for transferring goods or services to the customer. Typically, our contracts do not provide our customer with any right of return or refund; we do not constrain the contract price as it is probable that there will not be a significant revenue reversal due to a return or refund.
Typically, our customer contracts contain one or more of the following goods or services which constitute performance obligations.
Our proprietary software licenses typically provide for a perpetual right to use our software. Generally, our contracts do not provide significant services of integration and customization and installation services are not required to be purchased directly from us. The software is delivered before related services are provided and is functional without professional services, updates and technical support. We have concluded that the software license is distinct as the customer can benefit from the software on its own. Software revenue is typically recognized when the software is delivered or made available for download to the customer.
We recognize revenue for hardware sales when the product is shipped to the customer and when obligations that affect the customer’s final acceptance of the arrangement have been fulfilled. Hardware is purchased from suppliers and provided to the end-user customers via drop-ship or from inventory. We are responsible for negotiating the price both with the supplier and the customer, payment to the supplier, establishing payment terms and product returns with the customer, and bearing the credit risk if the customer does not pay for the goods. As the principal contact with the customer, we recognize revenue and cost of goods sold when we ship or are notified by the supplier that the product has been shipped. In certain limited instances, as shipping terms dictate, revenue is recognized upon receipt at the point of destination or upon installation at the customer site.
Our subscription service revenue is comprised of fees for contracts that provide customers a right to access our software for a subscribed period. We do not provide the customer the contractual right to license the software at any time outside of the subscription period under these contracts. Our subscription service revenue is primarily based on rates per location, including rates per points of sale and per room. We recognize certain subscription service revenue on a per-transaction basis. The customer can only benefit from the software and software maintenance when provided the right to access the software. Accordingly, each of the rights to access the software, the maintenance services, any hosting services, and any transaction-based services is not considered a distinct performance obligation in the context of the contract and should be combined into a single performance obligation to be recognized over the contract period. The Company recognizes subscription revenue over a one-month period based on the typical monthly invoicing and renewal cycle in accordance with our customer agreement terms.
We derive maintenance service revenue from providing unspecified updates, upgrades, bug fixes, and technical support services for our proprietary software. These services represent a stand-ready obligation that is concurrently delivered and has the same pattern of transfer to the customer; we account for these maintenance services as a single performance obligation. Maintenance revenue includes the same services provided by third-parties for remarketed software. We recognize substantially all maintenance revenue over the contract period of the maintenance agreement. We also recognize certain maintenance service revenue based on the volume of payment transactions processed by third parties through access to our software.
Professional services revenues primarily consist of fees for consulting, implementation, installation, integration and training and are generally recognized over time as the customer simultaneously receives and consumes the benefits of the professional services as the services are being performed. Certain professional development services are recognized upon delivery of the developed solutions to the customer. Professional services can be provided by internal or external providers, do not significantly affect the customer’s ability to access or use other provided goods or services, and provide a measure of benefit beyond that of other promised goods or services in the contract. As a result, professional services are considered distinct in the context of the contract and represent a separate performance obligation. Professional services that are billed on a time and materials basis are recognized over time as the services are performed. For contracts billed on a fixed price basis, revenue is recognized over time using an input method based on labor hours expended to date relative to the total labor hours expected to be required to satisfy the related performance obligation.
We use the market approach to drive standalone selling price (“SSP”) by maximizing observable data points (in the form of recently executed customer contracts) to determine the price customers are willing to pay for the goods and services transferred. If the contract contains a single performance obligation, the entire transaction price is allocated to that performance obligation. Contracts that contain multiple performance obligations require an allocation of the transaction price to each performance obligation based on a relative SSP basis.
Shipping and handling fees billed to customers are recognized as revenue and the related costs are recognized in cost of goods sold. Revenue is recorded net of any applicable taxes collected and remitted to governmental agencies.
39
Share-based compensation. We have an equity incentive plan under which we may grant non-qualified stock options, incentive stock options, stock-settled stock appreciation rights, restricted shares, restricted stock units and performance shares. Shares issued pursuant to awards under this plan may be made out of treasury or authorized but unissued shares.
We record compensation expense related to stock-settled stock appreciation rights, restricted shares, restricted stock units, performance shares, and employee stock purchase plan shares granted to certain employees and non-employee directors based on the fair value of the awards on the grant date. The fair value of restricted share and restricted stock unit grants subject only to a service condition is based on the closing price of our common shares on the grant date. For stock option and stock-settled appreciation right grants subject only to a service condition, we estimate the fair value on the grant date using the Black-Scholes-Merton option pricing model with inputs including the closing market price at grant date, exercise price and assumptions regarding the risk-free interest rate, expected volatility of our common shares based on historical volatility, and expected term as estimated using the simplified method. For employee stock purchase plan grants, we estimate the fair value on the grant date using the Black-Scholes-Merton option pricing model with inputs including the closing market price at grant date and assumptions regarding the risk-free interest rate, expected term, and expected volatility of our common shares over the offering period based on historical volatility. For restricted share, restricted stock unit and SSAR grants subject to a market condition, we estimate the fair value on the grant date through a lattice option pricing model that utilizes a Monte Carlo analysis with inputs including the closing market price at grant date, share price threshold, performance period term and assumptions regarding the risk-free interest rate and expected volatility of our common shares based on historical volatility. Inputs for SSAR grants subject to a market condition also include exercise price, remaining contractual term, and suboptimal exercise factor. Forfeitures of awards are recognized as they occur. Additional information regarding the assumptions used to value share-based compensation awards is provided in Note 13, Share-Based Compensation, to our Consolidated Financial Statements included under Item 8 of this Annual Report.
Accounting Pronouncements
See Note 2, Summary of Significant Accounting Policies, to our Consolidated Financial Statements included under Item 8 of this Annual Report for additional information about accounting pronouncements.
Item 7A. Quantitative and Qualitative Disclosures About Market Risk.
We have assets, liabilities, and cash flows in foreign currencies creating foreign exchange risk. We sell products and services internationally and enter into transactions denominated in foreign currencies. As a result, we are subject to the variability that arises from exchange rate movements. For the fiscal years 2024, 2023 and 2022, revenue from international operations was 6%, 7% and 7%, respectively, of total revenue. The effects of foreign currency on operating results did not have a material impact on our results of operations for the 2024, 2023 and 2022 fiscal years. Fluctuations in the value of other currencies could materially impact our revenue, expenses, operating profit and net income.
40
Item 8. Financial Statements and Supplementary Data.
Agilysys, Inc. and Subsidiaries
ANNUAL REPORT ON FORM 10-K
Year Ended March 31, 2024
INDEX TO CONSOLIDATED FINANCIAL STATEMENTS
41
Report of Independent Registered Public Accounting Firm
Board of Directors and Shareholders
Agilysys, Inc.
Opinion on the financial statements
We have audited the accompanying consolidated balance sheets of Agilysys, Inc. (a Delaware corporation) and subsidiaries (the “Company”) as of March 31, 2024 and 2023, the related consolidated statements of operations, comprehensive income (loss) shareholders’ equity, and cash flows for each of the three years in the period ended March 31, 2024, and the related notes and financial statement schedule included under Item 15(a) (collectively referred to as the “financial statements”). In our opinion, the financial statements present fairly, in all material respects, the financial position of the Company as of March 31, 2024 and 2023, and the results of its operations and its cash flows for each of the three years in the period ended March 31, 2024, in conformity with accounting principles generally accepted in the United States of America.
We also have audited, in accordance with the standards of the Public Company Accounting Oversight Board (United States) (“PCAOB”), the Company’s internal control over financial reporting as of March 31, 2024, based on criteria established in the 2013 Internal Control—Integrated Framework issued by the Committee of Sponsoring Organizations of the Treadway Commission (“COSO”), and our report dated May 21, 2024 expressed an unqualified opinion.
Basis for opinion
These financial statements are the responsibility of the Company’s management. Our responsibility is to express an opinion on the Company’s financial statements based on our audits. We are a public accounting firm registered with the PCAOB and are required to be independent with respect to the Company in accordance with the U.S. federal securities laws and the applicable rules and regulations of the Securities and Exchange Commission and the PCAOB.
We conducted our audits in accordance with the standards of the PCAOB. Those standards require that we plan and perform the audit to obtain reasonable assurance about whether the financial statements are free of material misstatement, whether due to error or fraud. Our audits included performing procedures to assess the risks of material misstatement of the financial statements, whether due to error or fraud, and performing procedures that respond to those risks. Such procedures included examining, on a test basis, evidence regarding the amounts and disclosures in the financial statements. Our audits also included evaluating the accounting principles used and significant estimates made by management, as well as evaluating the overall presentation of the financial statements. We believe that our audits provide a reasonable basis for our opinion.
Critical audit matters
Critical audit matters arising from the current period audit of the financial statements that were communicated or required to be communicated to the audit committee and that: (1) relate to accounts or disclosures that are material to the financial statements and (2) involved our especially challenging, subjective, or complex judgments. We determined that there are no critical audit matters.
/s/ GRANT THORNTON LLP
We have served as the Company’s auditor since 2015.
Atlanta, Georgia
May 21, 2024
42
Report of Independent Registered Public Accounting Firm
Board of Directors and Shareholders
Agilysys, Inc.
Opinion on internal control over financial reporting
We have audited the internal control over financial reporting of Agilysys, Inc. (a Delaware corporation) and subsidiaries (the “Company”) as of March 31, 2024, based on criteria established in the 2013 Internal Control—Integrated Framework issued by the Committee of Sponsoring Organizations of the Treadway Commission (“COSO”). In our opinion, the Company maintained, in all material respects, effective internal control over financial reporting as of March 31, 2024, based on criteria established in the 2013 Internal Control—Integrated Framework issued by COSO.
We also have audited, in accordance with the standards of the Public Company Accounting Oversight Board (United States) (“PCAOB”), the consolidated financial statements of the Company as of and for the year ended March 31, 2024, and our report dated May 21, 2024 expressed an unqualified opinion on those financial statements.
Basis for opinion
The Company’s management is responsible for maintaining effective internal control over financial reporting and for its assessment of the effectiveness of internal control over financial reporting, included in the accompanying Management’s Report on Internal Control Over Financial Reporting. Our responsibility is to express an opinion on the Company’s internal control over financial reporting based on our audit. We are a public accounting firm registered with the PCAOB and are required to be independent with respect to the Company in accordance with the U.S. federal securities laws and the applicable rules and regulations of the Securities and Exchange Commission and the PCAOB.
We conducted our audit in accordance with the standards of the PCAOB. Those standards require that we plan and perform the audit to obtain reasonable assurance about whether effective internal control over financial reporting was maintained in all material respects. Our audit included obtaining an understanding of internal control over financial reporting, assessing the risk that a material weakness exists, testing and evaluating the design and operating effectiveness of internal control based on the assessed risk, and performing such other procedures as we considered necessary in the circumstances. We believe that our audit provides a reasonable basis for our opinion.
Definition and limitations of internal control over financial reporting
A company’s internal control over financial reporting is a process designed to provide reasonable assurance regarding the reliability of financial reporting and the preparation of financial statements for external purposes in accordance with generally accepted accounting principles. A company’s internal control over financial reporting includes those policies and procedures that (1) pertain to the maintenance of records that, in reasonable detail, accurately and fairly reflect the transactions and dispositions of the assets of the company; (2) provide reasonable assurance that transactions are recorded as necessary to permit preparation of financial statements in accordance with generally accepted accounting principles, and that receipts and expenditures of the company are being made only in accordance with authorizations of management and directors of the company; and (3) provide reasonable assurance regarding prevention or timely detection of unauthorized acquisition, use, or disposition of the company’s assets that could have a material effect on the financial statements.
Because of its inherent limitations, internal control over financial reporting may not prevent or detect misstatements. Also, projections of any evaluation of effectiveness to future periods are subject to the risk that controls may become inadequate because of changes in conditions, or that the degree of compliance with the policies or procedures may deteriorate.
/s/
May 21, 2024
43
AGILYSYS, INC. AND SUBSIDIARIES
CONSOLIDATED BALANCE SHEETS
|
|
As of March 31, |
|
|||||
(In thousands, except share data) |
|
2024 |
|
|
2023 |
|
||
ASSETS |
|
|
|
|
|
|
||
Current assets: |
|
|
|
|
|
|
||
Cash and cash equivalents |
|
$ |
|
|
$ |
|
||
Accounts receivable, net of allowance for expected credit losses |
|
|
|
|
|
|
||
Contract assets |
|
|
|
|
|
|
||
Inventories |
|
|
|
|
|
|
||
Prepaid expenses and other current assets |
|
|
|
|
|
|
||
Total current assets |
|
|
|
|
|
|
||
Property and equipment, net |
|
|
|
|
|
|
||
Operating lease right-of-use assets |
|
|
|
|
|
|
||
Goodwill |
|
|
|
|
|
|
||
Intangible assets, net |
|
|
|
|
|
|
||
Deferred income taxes, non-current |
|
|
|
|
|
|
||
Other non-current assets |
|
|
|
|
|
|
||
Total assets |
|
$ |
|
|
$ |
|
||
LIABILITIES AND SHAREHOLDERS' EQUITY |
|
|
|
|
|
|
||
Current liabilities: |
|
|
|
|
|
|
||
Accounts payable |
|
$ |
|
|
$ |
|
||
Contract liabilities |
|
|
|
|
|
|
||
Accrued liabilities |
|
|
|
|
|
|
||
Operating lease liabilities, current |
|
|
|
|
|
|
||
Finance lease obligations, current |
|
|
|
|
|
|
||
Total current liabilities |
|
|
|
|
|
|
||
Deferred income taxes, non-current |
|
|
|
|
|
|
||
Operating lease liabilities, non-current |
|
|
|
|
|
|
||
Other non-current liabilities |
|
|
|
|
|
|
||
|
|
|
|
|
|
|||
Series A convertible preferred stock, no par value |
|
|
|
|
|
|
||
Shareholders' equity: |
|
|
|
|
|
|
||
Common shares, without par value, at $ |
|
|
|
|
|
|
||
Treasury shares, |
|
|
( |
) |
|
|
( |
) |
Capital in excess of stated value |
|
|
|
|
|
|
||
Retained earnings |
|
|
|
|
|
|
||
Accumulated other comprehensive loss |
|
|
( |
) |
|
|
( |
) |
Total shareholders' equity |
|
|
|
|
|
|
||
Total liabilities and shareholders' equity |
|
$ |
|
|
$ |
|
||
See accompanying notes to consolidated financial statements.
44
AGILYSYS, INC. AND SUBSIDIARIES
CONSOLIDATED STATEMENTS OF OPERATIONS
|
|
Year ended |
|
|||||||||
|
|
|
|
|||||||||
(In thousands, except per share data) |
|
2024 |
|
|
2023 |
|
|
2022 |
|
|||
Net revenue: |
|
|
|
|
|
|
|
|
|
|||
Products |
|
$ |
|
|
$ |
|
|
$ |
|
|||
Subscription and maintenance |
|
|
|
|
|
|
|
|
|
|||
Professional services |
|
|
|
|
|
|
|
|
|
|||
Total net revenue |
|
|
|
|
|
|
|
|
|
|||
Cost of goods sold: |
|
|
|
|
|
|
|
|
|
|||
Products |
|
|
|
|
|
|
|
|
|
|||
Subscription and maintenance |
|
|
|
|
|
|
|
|
|
|||
Professional services |
|
|
|
|
|
|
|
|
|
|||
Total cost of goods sold |
|
|
|
|
|
|
|
|
|
|||
Gross profit |
|
|
|
|
|
|
|
|
|
|||
Gross profit margin |
|
|
% |
|
|
% |
|
|
% |
|||
Operating expenses: |
|
|
|
|
|
|
|
|
|
|||
Product development |
|
|
|
|
|
|
|
|
|
|||
Sales and marketing |
|
|
|
|
|
|
|
|
|
|||
General and administrative |
|
|
|
|
|
|
|
|
|
|||
Depreciation of fixed assets |
|
|
|
|
|
|
|
|
|
|||
Amortization of internal-use software and intangibles |
|
|
|
|
|
|
|
|
|
|||
Other charges, net |
|
|
|
|
|
|
|
|
|
|||
Legal settlements |
|
|
|
|
|
|
|
|
|
|||
Total operating expense |
|
|
|
|
|
|
|
|
|
|||
Operating income |
|
|
|
|
|
|
|
|
|
|||
Other income (expense): |
|
|
|
|
|
|
|
|
|
|||
Interest income |
|
|
|
|
|
|
|
|
|
|||
Interest expense |
|
|
|
|
|
|
|
|
( |
) |
||
Other (expense) income, net |
|
|
( |
) |
|
|
|
|
|
|
||
Income before taxes |
|
|
|
|
|
|
|
|
|
|||
Income tax (benefit) provision |
|
|
( |
) |
|
|
|
|
|
|
||
Net income |
|
$ |
|
|
$ |
|
|
$ |
|
|||
Series A convertible preferred stock dividends |
|
|
( |
) |
|
|
( |
) |
|
|
( |
) |
Net income attributable to common shareholders |
|
$ |
|
|
$ |
|
|
$ |
|
|||
|
|
|
|
|
|
|
|
|
|
|||
Weighted average shares outstanding - basic |
|
|
|
|
|
|
|
|
|
|||
|
|
|
|
|
|
|
|
|
|
|||
Net income per share - basic: |
|
$ |
|
|
$ |
|
|
$ |
|
|||
|
|
|
|
|
|
|
|
|
|
|||
Weighted average shares outstanding - diluted |
|
|
|
|
|
|
|
|
|
|||
|
|
|
|
|
|
|
|
|
|
|||
Net income per share - diluted: |
|
$ |
|
|
$ |
|
|
$ |
|
|||
See accompanying notes to consolidated financial statements.
45
AGILYSYS, INC. AND SUBSIDIARIES
CONSOLIDATED STATEMENTS OF COMPREHENSIVE INCOME
|
|
Year Ended |
|
|||||||||
|
|
March 31, |
|
|||||||||
(In thousands) |
|
2024 |
|
|
2023 |
|
|
2022 |
|
|||
Net income |
|
$ |
|
|
$ |
|
|
$ |
|
|||
Other comprehensive loss: |
|
|
|
|
|
|
|
|
|
|||
Unrealized foreign currency translation adjustments |
|
|
( |
) |
|
|
( |
) |
|
|
( |
) |
Total comprehensive income |
|
$ |
|
|
$ |
|
|
$ |
|
|||
See accompanying notes to consolidated financial statements.
46
AGILYSYS, INC. AND SUBSIDIARIES
CONSOLIDATED STATEMENTS OF CASH FLOWS
|
|
Year Ended |
|
|||||||||
|
|
March 31, |
|
|||||||||
(In thousands) |
|
2024 |
|
|
2023 |
|
|
2022 |
|
|||
|
|
|
|
|
|
|
|
|
|
|||
Operating activities |
|
|
|
|
|
|
|
|
|
|||
Net income |
|
$ |
|
|
$ |
|
|
$ |
|
|||
Adjustments to reconcile net income to net cash provided by operating activities: |
|
|
|
|
|
|
|
|
|
|||
(Gain) loss on asset disposals |
|
|
( |
) |
|
|
|
|
|
|
||
Depreciation of fixed assets |
|
|
|
|
|
|
|
|
|
|||
Amortization of internal-use software and intangibles |
|
|
|
|
|
|
|
|
|
|||
Deferred income taxes |
|
|
( |
) |
|
|
( |
) |
|
|
( |
) |
Share-based compensation |
|
|
|
|
|
|
|
|
|
|||
Changes in operating assets and liabilities: |
|
|
|
|
|
|
|
|
|
|||
Accounts receivable |
|
|
( |
) |
|
|
|
|
|
|
||
Contract assets |
|
|
( |
) |
|
|
( |
) |
|
|
|
|
Inventory |
|
|
|
|
|
( |
) |
|
|
( |
) |
|
Prepaids and other current assets |
|
|
( |
) |
|
|
( |
) |
|
|
( |
) |
Accounts payable |
|
|
|
|
|
( |
) |
|
|
|
||
Contract liabilities |
|
|
|
|
|
|
|
|
|
|||
Accrued liabilities |
|
|
|
|
|
|
|
|
|
|||
Income taxes payable, net |
|
|
( |
) |
|
|
|
|
|
|
||
Other changes, net |
|
|
|
|
|
( |
) |
|
|
( |
) |
|
Net cash provided by operating activities |
|
|
|
|
|
|
|
|
|
|||
Investing activities |
|
|
|
|
|
|
|
|
|
|||
Capital expenditures |
|
|
( |
) |
|
|
( |
) |
|
|
( |
) |
Proceeds from sale of assets |
|
|
|
|
|
|
|
|
|
|||
Cash (paid for) business combinations, net of cash acquired |
|
|
|
|
|
|
|
|
( |
) |
||
Additional investments in corporate-owned life insurance policies |
|
|
( |
) |
|
|
( |
) |
|
|
( |
) |
Net cash used in investing activities |
|
|
( |
) |
|
|
( |
) |
|
|
( |
) |
Financing activities |
|
|
|
|
|
|
|
|
|
|||
Payment of preferred stock dividends |
|
|
( |
) |
|
|
( |
) |
|
|
( |
) |
Repurchase of common shares to satisfy employee tax withholding |
|
|
( |
) |
|
|
( |
) |
|
|
( |
) |
Principal payments under long-term obligations |
|
|
( |
) |
|
|
( |
) |
|
|
( |
) |
Net cash used in financing activities |
|
|
( |
) |
|
|
( |
) |
|
|
( |
) |
Effect of exchange rate changes on cash |
|
|
|
|
|
( |
) |
|
|
( |
) |
|
Net increase (decrease) in cash and cash equivalents |
|
|
|
|
|
|
|
|
( |
) |
||
Cash and cash equivalents at beginning of period |
|
|
|
|
|
|
|
|
|
|||
Cash and cash equivalents at end of period |
|
$ |
|
|
$ |
|
|
$ |
|
|||
See accompanying notes to consolidated financial statements.
47
AGILYSYS, INC. AND SUBSIDIARIES
|
|
Common Shares |
|
|
Capital in |
|
|
|
|
|
Accumulated |
|
|
|
|
|||||||||||||||||
|
|
Issued |
|
|
In Treasury |
|
|
excess of |
|
|
|
|
|
other |
|
|
|
|
||||||||||||||
(In thousands, except share data) |
|
Shares |
|
|
Stated |
|
|
Shares |
|
|
Stated |
|
|
Stated |
|
|
Retained |
|
|
comprehensive |
|
|
Total |
|
||||||||
Balance at March 31, 2021 |
|
|
|
|
$ |
|
|
|
( |
) |
|
$ |
( |
) |
|
$ |
|
|
$ |
|
|
$ |
|
|
$ |
|
||||||
Share-based compensation |
|
|
— |
|
|
|
— |
|
|
|
— |
|
|
|
— |
|
|
|
|
|
|
— |
|
|
|
— |
|
|
|
|
||
Restricted shares issued, net |
|
|
— |
|
|
|
— |
|
|
|
|
|
|
|
|
|
( |
) |
|
|
— |
|
|
|
— |
|
|
|
— |
|
||
Shares issued upon exercise of SSARs |
|
|
— |
|
|
|
— |
|
|
|
|
|
|
|
|
|
( |
) |
|
|
— |
|
|
|
— |
|
|
|
— |
|
||
Shares withheld for taxes upon |
|
|
— |
|
|
|
— |
|
|
|
( |
) |
|
|
( |
) |
|
|
( |
) |
|
|
— |
|
|
|
— |
|
|
|
( |
) |
Net income |
|
|
— |
|
|
|
— |
|
|
|
— |
|
|
|
— |
|
|
|
— |
|
|
|
|
|
|
— |
|
|
|
|
||
Series A convertible preferred stock issuance costs |
|
|
— |
|
|
|
— |
|
|
|
— |
|
|
|
— |
|
|
|
— |
|
|
|
— |
|
|
|
— |
|
|
|
— |
|
Series A convertible preferred stock dividends |
|
|
— |
|
|
|
— |
|
|
|
— |
|
|
|
— |
|
|
|
— |
|
|
|
( |
) |
|
|
— |
|
|
|
( |
) |
Unrealized translation adjustments |
|
|
— |
|
|
|
— |
|
|
|
— |
|
|
|
— |
|
|
|
— |
|
|
|
— |
|
|
|
( |
) |
|
|
( |
) |
Balance at March 31, 2022 |
|
|
|
|
$ |
|
|
|
( |
) |
|
$ |
( |
) |
|
$ |
|
|
$ |
|
|
$ |
( |
) |
|
$ |
|
|||||
Share-based compensation |
|
|
— |
|
|
|
— |
|
|
|
— |
|
|
|
— |
|
|
|
|
|
|
— |
|
|
|
— |
|
|
|
|
||
Restricted shares issued, net |
|
|
— |
|
|
|
— |
|
|
|
|
|
|
|
|
|
( |
) |
|
|
— |
|
|
|
— |
|
|
|
— |
|
||
Shares issued upon exercise of SSARs |
|
|
— |
|
|
|
— |
|
|
|
|
|
|
|
|
|
( |
) |
|
|
— |
|
|
|
— |
|
|
|
— |
|
||
Shares withheld for taxes upon |
|
|
— |
|
|
|
— |
|
|
|
( |
) |
|
|
( |
) |
|
|
( |
) |
|
|
— |
|
|
|
— |
|
|
|
( |
) |
Net income |
|
|
— |
|
|
|
— |
|
|
|
— |
|
|
|
— |
|
|
|
— |
|
|
|
|
|
|
— |
|
|
|
|
||
Series A convertible preferred stock dividends |
|
|
|
|
|
|
|
|
|
|
|
|
|
|
|
|
|
( |
) |
|
|
|
|
|
( |
) |
||||||
Unrealized translation adjustments |
|
|
— |
|
|
|
— |
|
|
|
— |
|
|
|
— |
|
|
|
— |
|
|
|
— |
|
|
|
( |
) |
|
|
( |
) |
Balance at March 31, 2023 |
|
|
|
|
$ |
|
|
|
( |
) |
|
$ |
( |
) |
|
$ |
|
|
$ |
|
|
$ |
( |
) |
|
$ |
|
|||||
Share-based compensation |
|
|
— |
|
|
|
— |
|
|
|
— |
|
|
|
— |
|
|
|
|
|
|
— |
|
|
|
— |
|
|
|
|
||
Restricted shares issued, net |
|
|
— |
|
|
|
— |
|
|
|
|
|
|
|
|
|
( |
) |
|
|
— |
|
|
|
— |
|
|
|
— |
|
||
Shares issued upon vesting of restricted stock units |
|
|
— |
|
|
|
— |
|
|
|
|
|
|
|
|
|
( |
) |
|
|
— |
|
|
|
— |
|
|
|
— |
|
||
Shares issued upon exercise of SSARs |
|
|
— |
|
|
|
— |
|
|
|
|
|
|
|
|
|
( |
) |
|
|
— |
|
|
|
— |
|
|
|
— |
|
||
Shares withheld for taxes upon |
|
|
— |
|
|
|
— |
|
|
|
( |
) |
|
|
( |
) |
|
|
( |
) |
|
|
— |
|
|
|
— |
|
|
|
( |
) |
Net income |
|
|
— |
|
|
|
— |
|
|
|
— |
|
|
|
— |
|
|
|
— |
|
|
|
|
|
|
— |
|
|
|
|
||
Conversion of Series A preferred stock |
|
|
|
|
|
|
|
|
— |
|
|
|
— |
|
|
|
|
|
|
— |
|
|
|
— |
|
|
|
|
||||
Series A convertible preferred stock dividends |
|
|
— |
|
|
|
— |
|
|
|
— |
|
|
|
— |
|
|
|
— |
|
|
|
( |
) |
|
|
— |
|
|
|
( |
) |
Unrealized translation adjustments |
|
|
— |
|
|
|
— |
|
|
|
— |
|
|
|
— |
|
|
|
— |
|
|
|
— |
|
|
|
( |
) |
|
|
( |
) |
Balance at March 31, 2024 |
|
|
|
|
$ |
|
|
|
( |
) |
|
$ |
( |
) |
|
$ |
|
|
$ |
|
|
$ |
( |
) |
|
$ |
|
|||||
See accompanying notes to consolidated financial statements.
48
Agilysys, Inc. and Subsidiaries
Notes to Consolidated Financial Statements
(Table amounts in thousands, except per share data)
1. Nature of Operations
Agilysys has been a leader in hospitality software for more than 45 years, delivering innovative cloud-native SaaS and on-premise solutions for hotels, resorts and cruise lines, casinos, corporate foodservice management, restaurants, universities, stadiums, and healthcare. The Company’s software solutions include point-of-sale (POS), property management (PMS), inventory and procurement, payments, and related applications that manage and enhance the entire guest journey. Agilysys is also known for its world-class customer-centric service. Many of the top hospitality companies around the world use Agilysys solutions to improve guest loyalty, drive revenue growth, and increase operational efficiencies. Agilysys operates across North America, Europe, the Middle East, Asia-Pacific, and India, with headquarters in Alpharetta, GA.
The Company has just one reportable segment serving the global hospitality industry.
Reference herein to any particular year or quarter refers to periods within the fiscal year ended March 31. For example, fiscal 2024 refers to the fiscal year ended March 31, 2024.
2. Summary of Significant Accounting Policies
Principles of consolidation. The consolidated financial statements include the accounts of Agilysys, Inc. and subsidiaries. Investments in affiliated companies are accounted for by the equity or cost method, as appropriate. All inter-company accounts have been eliminated.
Use of estimates. Preparation of consolidated financial statements in conformity with U.S. generally accepted accounting principles (“GAAP”) requires management to make estimates and assumptions. These estimates and assumptions affect the reported amounts of assets and liabilities at the date of the financial statements and the reported amounts of revenue and expenses during the reported periods. Actual results could differ from those estimates.
Cash and cash equivalents.
Allowance for expected credit losses. We maintain allowances for expected credit losses for estimated losses resulting from the inability or unwillingness of our customers to make required payments. We base our expected credit loss model on historical experience, adjusted for current conditions and reasonable and supportable forecasts. To help mitigate the associated credit risk we perform periodic credit evaluations of our customers.
Customer credit allowance. We maintain allowances for estimated customer credits. Credits are typically due to the timing or amount of customer invoices processed for specific services, including professional and subscription, and maintenance coverage. In certain cases, there has not been clear or timely communication of the need to adjust coverage or service at a location in advance of when we invoice for the associated coverage or service. We will issue a credit after agreeing to the service or coverage adjustment as requested by the customer within the terms of our contract.
Inventories. Our inventories are comprised of finished goods. Inventories are stated at the lower of cost or net realizable value, net of related reserves. The cost of inventory is computed using a weighted-average method. Our inventory is monitored to ensure appropriate valuation. Adjustments of inventories to the lower of cost or net realizable value, if necessary, are based upon contractual provisions such as turnover and assumptions about future demand and market conditions. If assumptions about future demand change and/or actual market conditions are less favorable than those projected by management, additional adjustments to inventory valuations
49
may be required. We provide a reserve for obsolescence, which is calculated based on several factors, including an analysis of historical sales of products and the age of the inventory. Actual amounts could be different from those estimated.
Leases. We determine if an arrangement is or contains a lease at inception. Operating leases are presented as Right-of-Use (“ROU”) assets and the corresponding lease liabilities are included in operating lease liabilities – current and operating lease liabilities – non-current on our Consolidated Balance Sheet. ROU assets represent our right to use the underlying asset, and lease liabilities represent our obligation for lease payments in exchange for the ability to use the asset for the duration of the lease term.
ROU assets and lease liabilities are recognized at commencement date and determined using the present value of the remaining lease payments over the lease term. We use an incremental borrowing rate based on estimated rate of interest for collateralized borrowing since our leases do not include an implicit interest rate. The estimated incremental borrowing rate considers market data, actual lease economic environment, and actual lease term at commencement date. The lease term may include options to extend when it is reasonably certain that we will exercise that option. ROU assets include lease payments made in advance, and excludes any incentives received or initial direct costs incurred. We recognize lease expense on a straight-line basis over the lease term and sublease income on a straight-line basis over the sublease term.
We have lease agreements with lease and non-lease components which we account for as a single lease component. We also have leases which include variable lease payments, which are expensed as incurred. Our variable lease payments are not based on an index or rate and therefore are excluded from the calculation of lease liabilities. We have elected to not recognize short term leases that have a term of twelve months or less as ROU assets or lease liabilities. Our short-term leases are not material and do not have a material impact on our ROU assets or lease liabilities. Additionally, we do not have any covenants, residual value guarantees, or related party transactions associated with our lease agreements.
Goodwill and other indefinite-lived intangible assets. Goodwill represents the excess purchase price paid over the fair value of the net assets of acquired companies. As of March 31, 2024 and 2023, the carrying amount of goodwill was $
Acquired intangible assets. Acquired intangible assets include identifiable customer relationships, non-competition agreements, developed technology, and trade names. We amortize the cost of finite-lived identifiable intangible assets over their estimated useful lives, which are periods of
Long-lived assets. Property and equipment are recorded at cost. Major renewals and improvements are capitalized. Minor replacements, maintenance, repairs, and reengineering costs are expensed as incurred. When assets are sold or otherwise disposed of, the cost and related accumulated depreciation are eliminated from the accounts and any resulting gain or loss is recognized.
Depreciation and amortization are provided in amounts sufficient to amortize the cost of the assets, including assets recorded under finance leases, which make up less than
We evaluate the recoverability of our long-lived assets whenever changes in circumstances or events may indicate that the carrying amounts may not be recoverable. An impairment loss is recognized in the event the carrying value of the assets exceeds the future undiscounted cash flows attributable to such assets. Our long-lived assets and impairments considerations are discussed further in Note 4, Property and Equipment, Net.
Foreign currency translation. The financial statements of our foreign operations are translated into U.S. dollars for financial reporting purposes. The assets and liabilities of foreign operations whose functional currencies are not in U.S. dollars are translated at the period-end exchange rates, while revenue and expenses are translated at weighted-average exchange rates during the fiscal year. The cumulative translation effects are reflected as a component of “Accumulated other comprehensive loss” within shareholders’ equity in
50
the Consolidated Balance Sheets. Gains and losses on monetary transactions denominated in other than the functional currency of an operation are reflected within “Other (income) expenses, net” in the Consolidated Statements of Operations. Foreign currency gains and losses from changes in exchange rates have not been material to our consolidated operating results.
Revenue recognition. We derive revenue from the sale of products (proprietary software licenses, third party hardware and operating systems), subscription and maintenance, and professional services. For the fiscal years 2024, 2023 and 2022, revenue from international operations was
Our customary business practice is to enter into legally enforceable written contracts with our customers. The majority of our contracts are governed by a master service agreement between us and the customer, which sets forth the general terms and conditions of any individual contract between the parties, which is then supplemented by a customer order to specify the different goods and services, the associated prices, and any additional terms for an individual contract. Performance obligations specific to each individual contract are defined within the terms of each order. Each performance obligation is identified based on the goods and services that will be transferred to our customer that are both capable of being distinct and are distinct within the context of the contract. The transaction price is determined based on the consideration to which we will be entitled and expect to receive in exchange for transferring goods or services to the customer. Typically, our contracts do not provide our customer with any right of return or refund; we do not constrain the contract price as it is probable that there will not be a significant revenue reversal due to a return or refund.
Typically, our customer contracts contain one or more of the following goods or services which constitute performance obligations.
Our proprietary software licenses typically provide for a perpetual right to use our software. Generally, our contracts do not provide significant services of integration and customization and installation services are not required to be purchased directly from us. The software is delivered before related services are provided and is functional without professional services, updates and technical support. We have concluded that the software license is distinct as the customer can benefit from the software on its own. Software revenue is typically recognized when the software is delivered or made available for download to the customer.
We recognize revenue for hardware sales when the product is shipped to the customer and when obligations that affect the customer’s final acceptance of the arrangement have been fulfilled. Hardware is purchased from suppliers and provided to the end-user customers via drop-ship or from inventory. We are responsible for negotiating price both with the supplier and the customer, payment to the supplier, establishing payment terms and product returns with the customer, and we bear the credit risk if the customer does not pay for the goods. As the principal contact with the customer, we recognize revenue and cost of goods sold when we ship or are notified by the supplier that the product has been shipped. In certain limited instances, as shipping terms dictate, revenue is recognized upon receipt at the point of destination or upon installation at the customer site.
Our subscription service revenue is comprised of fees for contracts that provide customers a right to access our software for a subscribed period. We do not provide the customer the contractual right to license the software at any time outside of the subscription period under these contracts. Our subscription service revenue is primarily based on rates per location, including rates per points of sale and per room. We recognize certain subscription service revenue on a per-transaction basis. The customer can only benefit from the software and software maintenance when provided the right to access the software. Accordingly, each of the rights to access the software, the maintenance services, any hosting services, and any transaction-based services is not considered a distinct performance obligation in the context of the contract and should be combined into a single performance obligation to be recognized over the contract period. The Company recognizes subscription revenue over a one-month period based on the typical monthly invoicing and renewal cycle in accordance with our customer agreement terms.
We derive maintenance service revenue from providing unspecified updates, upgrades, bug fixes, and technical support services for our proprietary software. These services represent a stand-ready obligation that is concurrently delivered and has the same pattern of transfer to the customer; we account for these maintenance services as a single performance obligation. Maintenance revenue includes the same services provided by third-parties for remarketed software. We recognize substantially all maintenance revenue over the contract period of the maintenance agreement. We also recognize certain maintenance service revenue based on the volume of payment transactions processed by third parties through access to our software.
Professional services revenues primarily consist of fees for consulting, implementation, installation, integration and training and are generally recognized over time as the customer simultaneously receives and consumes the benefits of the professional services as the services are being performed. Certain professional development services are recognized upon delivery of the developed solutions to the customer. Professional services can be provided by internal or external providers, do not significantly affect the customer’s ability to access or use other provided goods or services, and provide a measure of benefit beyond that of other promised goods or services in the contract. As a result, professional services are considered distinct in the context of the contract and represent a separate performance obligation. Professional services that are billed on a time and materials basis are recognized over time as the services are
51
performed. For contracts billed on a fixed price basis, revenue is recognized over time using an input method based on labor hours expended to date relative to the total labor hours expected to be required to satisfy the related performance obligation.
We use the market approach to derive standalone selling price (“SSP”) by maximizing observable data points (in the form of recently executed customer contracts) to determine the price customers are willing to pay for the goods and services transferred. If the contract contains a single performance obligation, the entire transaction price is allocated to that performance obligation. Contracts that contain multiple performance obligations require an allocation of the transaction price to each performance obligation based on a relative SSP basis.
Shipping and handling fees billed to customers are recognized as revenue and the related costs are recognized in cost of goods sold. Revenue is recorded net of any applicable taxes collected and remitted to governmental agencies.
Comprehensive income. Comprehensive income is the total of net income, as currently reported under GAAP, plus other comprehensive income (loss). Other comprehensive income considers the effects of additional transactions and economic events that are not required to be recorded in determining net income, but rather are reported as a separate statement of comprehensive income.
Fair value measurements. We measure the fair value of financial assets and liabilities on a recurring or non-recurring basis. Financial assets and liabilities measured on a recurring basis are those that are adjusted to fair value each time a financial statement is prepared. Financial assets and liabilities measured on a non-recurring basis are those that are adjusted to fair value when a significant event occurs. In determining fair value of financial assets and liabilities, we use various valuation techniques.
Investments in corporate-owned life insurance policies. Agilysys invests in corporate-owned life insurance policies, for which some are endorsement split-dollar life insurance arrangements. We entered into agreements with certain former executives, whereby we must maintain the life insurance policy for a specified amount and split a portion of the policy benefits with their respective designated beneficiary. Our investment in these corporate-owned life insurance policies were recorded at their cash surrender value, which approximates fair value at the balance sheet date. In the Consolidated Balance Sheets at the balance sheet date, the cash surrender value of $
Income Taxes. Income tax expense includes U.S. and foreign income taxes and is based on reported income before income taxes. We recognize deferred tax assets and liabilities based on the differences between the financial statement carrying amounts and the tax basis of assets and liabilities. The deferred tax assets and liabilities are determined based on the enacted tax rates expected to apply in the periods in which the deferred tax assets or liabilities are anticipated to be settled or realized.
We regularly review our deferred tax assets for recoverability and establish a valuation allowance if it is more likely than not that some portion, or all, of a deferred tax asset will not be realized. The determination as to whether a deferred tax asset will be realized is made on a jurisdictional basis and is based on the evaluation of positive and negative evidence. This evidence includes historical taxable income, projected future taxable income, the expected timing of the reversal of existing temporary differences and the implementation of tax planning strategies.
We recognize the tax benefit from uncertain tax positions only if it is more likely than not that the tax position will be sustained on examination by the taxing authorities, based on the technical merits of the position. The tax benefits recognized from uncertain tax positions are measured at the largest amount of benefit that is greater than fifty percent likely of being realized upon ultimate settlement. No tax benefits are recognized for positions that do not meet this threshold. Interest related to uncertain tax positions is recognized as part of the provision for income taxes and is accrued beginning in the period that such interest would be applicable under relevant tax law until such time that the related tax benefits are recognized. Our income taxes are described further in Note 9, Income Taxes.
Recently Issued Accounting Pronouncements
In December 2023, the Financial Accounting Standards Board (“FASB”) issued Accounting Standards Update (“ASU”) No. 2023-09 Income Taxes (Topic 740): Improvements to Income Tax Disclosures (“ASU 2023-09”) to update income tax disclosure requirements primarily by requiring specific categories and greater disaggregation within the rate reconciliation and disaggregation of income taxes
52
paid by jurisdiction. The amendments in the ASU also remove disclosures related to certain unrecognized tax benefits and deferred taxes. ASU 2023-09 is effective for fiscal years beginning after December 15, 2024, or our fiscal 2026. The amendments may be applied prospectively or retrospectively with early adoption permitted. We are currently assessing the impact of the requirements on our consolidated financial statements and disclosures.
In November 2023, the FASB issued ASU No. 2023-07 Segment Reporting (Topic 280): Improvements to Reportable Segment Disclosures (“ASU 2023-07”) to expand reportable segment disclosure requirements, primarily through enhanced disclosures about significant segment expenses. The amendments in the ASU require that a public entity disclose, on an annual and interim basis, significant segment expenses that are regularly provided to an entity's chief operating decision maker (“CODM”), a description of other segment items by reportable segment, and any additional measures of a segment's profit or loss used by the CODM when deciding how to allocate resources. ASU 2023-07 applies to entities with a single reportable segment. Annual disclosures are required for fiscal years beginning after December 15, 2023, or our fiscal 2025. Interim disclosures are required for periods within fiscal years beginning after December 15, 2024, or our fiscal 2026. Retrospective application is required for all prior periods presented with early adoption is permitted. We are currently assessing the impact of the requirements on our consolidated financial statements and disclosures.
3. Revenue Recognition
For in depth discussion regarding our revenue recognition procedures for our revenue streams, see Note 2, Summary of Significant Accounting Policies.
Disaggregation of Revenue
We derive and report our revenue from the sale of products (proprietary software licenses, third party hardware and operating systems), subscription and maintenance, and professional services. Revenue recognized at a point in time (products) totaled $
Contract Balances
Contract assets are rights to consideration in exchange for goods or services that we have transferred to a customer when that right is conditional on something other than the passage of time. The majority of our contract assets represent unbilled amounts related to products and professional services. We expect billing and collection of our contract assets to occur within the next twelve months. We receive payments from customers based upon contractual billing schedules and accounts receivable are recorded when the right to consideration becomes unconditional. Contract liabilities represent consideration received or consideration which is unconditionally due from customers prior to transferring goods or services to the customer under the terms of the contract.
Revenue recognized from amounts included in contract liabilities at the beginning of the period was $
Our arrangements are for a period of one year or less. As a result, unsatisfied performance obligations as of March 31, 2024 are expected to be satisfied and the allocated transaction price recognized in revenue within a period of 12 months or less.
Assets Recognized from Costs to Obtain a Contract
Sales commission expenses that would not have occurred absent the customer contracts are considered incremental costs to obtain a contract. We have elected to take the practical expedient available to expense the incremental costs to obtain a contract as incurred when the expected benefit and amortization period is one year or less. For subscription contracts that are renewed monthly based on an agreement term, we capitalize commission expenses and amortize as we satisfy the underlying performance obligations, generally based on the contract terms and anticipated renewals. For first year support and maintenance service contracts, commission expenses are immaterial and therefore expenses as incurred. Other sales commission expenses are not material or have a period of benefit of one year or less, and are therefore expensed as incurred in line with the practical expedient elected.
We had $
53
million, respectively. These expenses are included in operating expenses – sales and marketing in our Consolidated Statement of Operations. All other costs to obtain a contract are not considered incremental and therefore are expensed as incurred.
4. Property and Equipment, Net
Property and equipment at March 31, 2024 and 2023 is as follows:
|
|
Year ended March 31, |
|
|||||
(In thousands) |
|
|
2024 |
|
|
|
2023 |
|
Furniture and equipment |
|
$ |
|
|
$ |
|
||
Software |
|
|
|
|
|
|
||
Leasehold improvements |
|
|
|
|
|
|
||
Facilities construction in progress |
|
|
|
|
|
|
||
|
|
|
|
|
|
|
||
Accumulated depreciation and amortization |
|
|
( |
) |
|
|
( |
) |
Property and equipment, net |
|
$ |
|
|
$ |
|
||
Total depreciation expense on property and equipment was $
The Company capitalizes internal-use software, including software purchased and used exclusively in providing services or that is only made available to customers as a software service, as property and equipment under ASC 350-40, Internal-Use Software. Total amortization expense on capitalized internal-use software was $
Assets under financing leases are included in property and equipment categories above and further disclosed with Note 6. Leases.
5. Intangible Assets, Goodwill, and Software Development Costs
The following table summarizes our intangible assets and software development costs at March 31, 2024, and 2023:
|
|
March 31, 2024 |
|
|
March 31, 2023 |
|
||||||||||||||||||||||||||
|
|
Gross |
|
|
|
|
|
|
|
|
Net |
|
|
Gross |
|
|
|
|
|
|
|
|
Net |
|
||||||||
|
|
carrying |
|
|
Accumulated |
|
|
Accumulated |
|
|
carrying |
|
|
carrying |
|
|
Accumulated |
|
|
Accumulated |
|
|
carrying |
|
||||||||
(In thousands) |
|
amount |
|
|
amortization |
|
|
Impairment |
|
|
amount |
|
|
amount |
|
|
amortization |
|
|
impairment |
|
|
amount |
|
||||||||
Finite-lived intangible assets: |
|
|
|
|
|
|
|
|
|
|
|
|
|
|
|
|
|
|
|
|
|
|
|
|
||||||||
Customer relationships |
|
$ |
|
|
$ |
( |
) |
|
$ |
— |
|
|
$ |
|
|
$ |
|
|
$ |
( |
) |
|
$ |
— |
|
|
$ |
|
||||
Non-competition agreements |
|
|
|
|
|
( |
) |
|
|
— |
|
|
|
|
|
|
|
|
|
( |
) |
|
|
— |
|
|
|
|
||||
Developed technology |
|
|
|
|
|
( |
) |
|
|
— |
|
|
|
|
|
|
|
|
|
( |
) |
|
|
— |
|
|
|
|
||||
Trade names |
|
|
|
|
|
( |
) |
|
|
— |
|
|
|
|
|
|
|
|
|
( |
) |
|
|
— |
|
|
|
|
||||
Patented technology |
|
|
|
|
|
( |
) |
|
|
— |
|
|
|
— |
|
|
|
|
|
|
( |
) |
|
|
— |
|
|
|
— |
|
||
|
|
|
|
|
|
( |
) |
|
|
— |
|
|
|
|
|
|
|
|
|
( |
) |
|
|
— |
|
|
|
|
||||
Indefinite-lived trade names |
|
|
|
|
N/A |
|
|
|
— |
|
|
|
|
|
|
|
|
N/A |
|
|
|
— |
|
|
|
|
||||||
Total intangible assets |
|
$ |
|
|
$ |
( |
) |
|
$ |
— |
|
|
$ |
|
|
$ |
|
|
$ |
( |
) |
|
$ |
— |
|
|
$ |
|
||||
|
|
|
|
|
|
|
|
|
|
|
|
|
|
|
|
|
|
|
|
|
|
|
|
|
||||||||
(In thousands) |
|
|
|
|
|
|
|
|
|
|
|
|
|
|
|
|
|
|
|
|
|
|
|
|
||||||||
Software development costs |
|
$ |
|
|
$ |
( |
) |
|
$ |
( |
) |
|
$ |
— |
|
|
$ |
|
|
$ |
( |
) |
|
$ |
( |
) |
|
$ |
— |
|
||
During the year ended March 31, 2024, goodwill increased $
During the year ended March 31, 2024, finite-lived intangible assets decreased $
See Note 15, Business Combination, for more information on business combination activity.
Estimated future amortization expense on finite-lived intangible assets is as follows:
54
(In thousands) |
|
Estimated Amortization Expense |
|
|
Fiscal year ending March 31, |
|
|
|
|
2025 |
|
$ |
|
|
2026 |
|
|
|
|
2027 |
|
|
|
|
2028 |
|
|
|
|
Thereafter |
|
|
|
|
Total |
|
$ |
|
|
Indefinite-lived intangible assets, comprised of our purchased trade name InfoGenesis as of March 31, 2024 and 2023 are tested for impairment upon identification of impairment indicators or at least annually. An impairment loss is recognized if the carrying amount is greater than fair value. The InfoGenesis indefinite-lived purchased trade name impairment testing resulted in a fair value exceeding the carrying amount for the years ending March 31, 2024, 2023 and 2022.
6. Leases
The majority of our leases are comprised of real estate leases for our respective offices around the globe. Our finance leases consist of office equipment. We have no residual value guarantees or restrictions or covenants imposed by or associated with our active leases.
We do not have any related party leases. We have variable payments for expenses such as common area maintenance and taxes. We do not have variable payments that are based on an index or rate. As a result, we do not include variable payments in the calculation of the lease liability. Any variable costs are expensed as incurred.
We subleased one of our office leases located in Bellevue, Washington with a lease term that expired during fiscal year 2024.
The components of lease expenses, which are included in operating expenses in our Consolidated Statements of Operations, were as follows:
|
|
Year ended March 31, |
|
|||||
(In thousands) |
|
2024 |
|
|
2023 |
|
||
Operating leases expense |
|
$ |
|
|
$ |
|
||
Finance lease expense: |
|
|
|
|
|
|
||
Amortization of ROU assets |
|
|
|
|
|
|
||
Interest on lease liabilities |
|
|
|
|
|
|
||
Total finance lease expense |
|
|
|
|
|
|
||
Variable lease costs |
|
|
|
|
|
|
||
Short term lease expense |
|
|
|
|
|
|
||
Sublease income |
|
|
( |
) |
|
|
( |
) |
Total lease expense |
|
$ |
|
|
$ |
|
||
Other information related to leases for fiscal 2024 and 2023 was as follows:
|
|
Year ended March 31, |
|
|||||
Supplemental cash flow information |
|
2024 |
|
|
2023 |
|
||
Cash paid for amounts included in the measurement of lease liabilities |
|
|
|
|
|
|
||
Operating cash flows for operating leases |
|
$ |
|
|
$ |
|
||
Operating cash flows for finance leases |
|
|
|
|
|
|
||
Financing cash flows for finance leases |
|
|
|
|
|
|
||
ROU assets obtained in exchange for lease obligations (in thousands): |
|
|
|
|
|
|
||
Operating leases |
|
$ |
|
|
$ |
|
||
Weighted average remaining lease terms |
|
|
|
|
|
|
||
Operating leases |
|
|
|
|
|
|
||
Finance leases |
|
— |
|
|
|
|
||
Weighted average discount rates |
|
|
|
|
|
|
||
Operating leases |
|
|
% |
|
|
% |
||
Finance leases |
|
|
|
|
% |
|||
55
The table below reconciles the undiscounted future minimum lease payments (displayed by year and in the aggregate) under non-cancelable leases with terms of more than one year to the total lease liabilities recognized on the Consolidated Balance Sheet as of March 31, 2024:
(In thousands) |
|
Operating leases |
|
|
Fiscal year ending March 31, |
|
|
|
|
2025 |
|
$ |
|
|
2026 |
|
|
|
|
2027 |
|
|
|
|
2028 |
|
|
|
|
2029 |
|
|
|
|
Thereafter |
|
|
|
|
Total undiscounted future minimum lease payments |
|
|
|
|
Less: difference between undiscounted lease payments and discounted lease |
|
|
( |
) |
Total lease liabilities |
|
$ |
|
|
7. Supplemental Disclosures of Cash Flow Information
Additional information related to the Consolidated Statements of Cash Flows is as follows:
|
|
Year ended March 31, |
|
|||||||||
(In thousands) |
|
|
2024 |
|
|
|
2023 |
|
|
|
2022 |
|
Cash receipts for interest |
|
$ |
|
|
$ |
|
|
$ |
|
|||
Cash payments for income tax, net |
|
|
|
|
|
|
|
|
|
|||
Accrued capital expenditures |
|
|
|
|
|
|
|
|
|
|||
8. Additional Balance Sheet Information
Additional information related to the Consolidated Balance Sheets is as follows:
(In thousands) |
|
March 31, 2024 |
|
|
March 31, 2023 |
|
||
Accrued liabilities: |
|
|
|
|
|
|
||
Salaries, wages, employee benefits, and payroll taxes |
|
$ |
|
|
$ |
|
||
Income and indirect taxes payable |
|
|
|
|
|
|
||
Other |
|
|
|
|
|
|
||
Total |
|
$ |
|
|
$ |
|
||
Other non-current liabilities: |
|
|
|
|
|
|
||
Uncertain tax positions |
|
$ |
|
|
$ |
|
||
Employee benefit obligations |
|
|
|
|
|
|
||
Other |
|
|
|
|
|
|
||
Total |
|
$ |
|
|
$ |
|
||
9. Income Taxes
For the year ended March 31, income before income taxes consisted of the following:
(In thousands) |
|
|
2024 |
|
|
|
2023 |
|
|
|
2022 |
|
Income before income taxes |
|
|
|
|
|
|
|
|
|
|||
United States |
|
$ |
|
|
$ |
|
|
$ |
|
|||
Foreign |
|
|
|
|
|
|
|
|
|
|||
Total income before income taxes |
|
$ |
|
|
$ |
|
|
$ |
|
|||
56
For the year ended March 31, income tax expense (benefit) consisted of the following:
(In thousands) |
|
|
2024 |
|
|
|
2023 |
|
|
|
2022 |
|
Income tax (benefit) provision |
|
|
|
|
|
|
|
|
|
|||
Current: |
|
|
|
|
|
|
|
|
|
|||
Federal |
|
$ |
|
|
$ |
|
|
$ |
|
|||
State and local |
|
|
|
|
|
|
|
|
|
|||
Foreign |
|
|
|
|
|
|
|
|
|
|||
Deferred: |
|
|
|
|
|
|
|
|
|
|||
Federal |
|
|
( |
) |
|
|
|
|
|
|
||
State and local |
|
|
( |
) |
|
|
|
|
|
|
||
Foreign |
|
|
( |
) |
|
|
( |
) |
|
|
( |
) |
Income tax (benefit) provision |
|
$ |
( |
) |
|
$ |
|
|
$ |
|
||
The following table presents the principal components of the difference between the effective tax rate and the U.S. federal statutory income tax rate for the years ended March 31:
(In thousands) |
|
2024 |
|
|
2023 |
|
|
2022 |
|
|||
Income tax expense (benefit) at the U.S. Federal statutory rate |
|
$ |
|
|
$ |
|
|
$ |
|
|||
Expense (benefit) for state taxes |
|
|
|
|
|
|
|
|
( |
) |
||
Impact of foreign operations |
|
|
( |
) |
|
|
( |
) |
|
|
( |
) |
R&D credits |
|
|
( |
) |
|
|
|
|
|
|
||
Global intangible low-taxed income |
|
|
|
|
|
|
|
|
|
|||
Indefinite life assets |
|
|
|
|
|
|
|
|
|
|||
Intercompany gain |
|
|
|
|
|
|
|
|
|
|||
Rate change |
|
|
( |
) |
|
|
|
|
|
|
||
Change in valuation allowance |
|
|
( |
) |
|
|
( |
) |
|
|
( |
) |
Change in liability for unrecognized tax benefits |
|
|
( |
) |
|
|
|
|
|
|
||
Share-based compensation |
|
|
( |
) |
|
|
( |
) |
|
|
( |
) |
Deferred adjustments |
|
|
|
|
|
( |
) |
|
|
( |
) |
|
Provision to return |
|
|
( |
) |
|
|
( |
) |
|
|
|
|
Other |
|
|
|
|
|
|
|
|
( |
) |
||
Income tax (benefit) provision |
|
$ |
( |
) |
|
$ |
|
|
$ |
|
||
We have elected to account for global intangible low-taxed income (GILTI) inclusions in the period in which they are incurred.
The fiscal 2024 tax provision results primarily from the release of the valuation allowances against U.S. Federal and State deferred tax assets. The fiscal 2024 tax provision differs from the statutory rate primarily due to the release of the valuation allowances.
The fiscal 2023 tax provision results primarily from foreign tax expense and minimal expense from the U.S. The fiscal 2023 tax provision differs from the statutory rate primarily due to adjustments to deferred tax assets; offset by current year expense in foreign jurisdictions.
57
Deferred tax assets and liabilities as of March 31, are as follows:
(In thousands) |
|
2024 |
|
|
2023 |
|
||
Deferred tax assets: |
|
|
|
|
|
|
||
Accrued liabilities |
|
$ |
|
|
$ |
|
||
Allowance for expected credit losses and doubtful accounts |
|
|
|
|
|
|
||
Federal losses and credit carryforwards |
|
|
|
|
|
|
||
Foreign losses and credit carryforwards |
|
|
|
|
|
|
||
State losses and credit carryforwards |
|
|
|
|
|
|
||
Deferred revenue |
|
|
|
|
|
|
||
Capitalized research expenses |
|
|
|
|
|
|
||
Property and equipment and software amortization |
|
|
|
|
|
|
||
Operating lease liabilities |
|
|
|
|
|
|
||
Goodwill and other intangible assets |
|
|
( |
) |
|
|
( |
) |
Other |
|
|
|
|
|
|
||
|
|
|
|
|
|
|
||
Less: valuation allowance |
|
|
( |
) |
|
|
( |
) |
Total |
|
|
|
|
|
|
||
|
|
|
|
|
|
|
||
Deferred tax liabilities: |
|
|
|
|
|
|
||
Operating lease right-of-use assets |
|
|
( |
) |
|
|
( |
) |
Goodwill and other intangible assets |
|
|
( |
) |
|
|
( |
) |
Other |
|
|
( |
) |
|
|
|
|
Total |
|
|
( |
) |
|
|
( |
) |
Total deferred tax assets, net |
|
$ |
|
|
$ |
|
||
At March 31, 2024, we had $
At March 31, 2024 we also had $
We have recorded valuation allowances offsetting certain deferred income tax assets due to the uncertainty of the ultimate realization of the future benefits from those assets. At March 31, 2024, the total valuation allowance against deferred tax assets of $
The undistributed earnings of our foreign subsidiaries are not subject to U.S. federal and state income taxes unless such earnings are distributed in the form of dividends or otherwise to the extent of current and accumulated earnings and profits. The undistributed earnings of foreign subsidiaries are permanently reinvested and totaled $
58
Uncertain tax positions as of March 31, are as follows:
(In thousands) |
|
2024 |
|
|
2023 |
|
|
2022 |
|
|||
Beginning gross unrecognized tax benefits |
|
$ |
|
|
$ |
|
|
$ |
|
|||
Decreases related to prior year tax positions |
|
|
( |
) |
|
|
|
|
|
|
||
Increases related to current year tax positions |
|
|
|
|
|
|
|
|
|
|||
Ending gross unrecognized tax benefits |
|
$ |
|
|
$ |
|
|
$ |
|
|||
We recognize interest accrued on any uncertain tax positions as a component of income tax expense. Penalties are recognized as a component of general and administrative expenses. For the year ended March 31, 2024, we reduced accrued interest and penalty by $
We are consistently subject to tax audits. Due to the nature of examinations in multiple jurisdictions, changes could occur in the amount of gross unrecognized tax benefits during the next 12 months that we cannot anticipate.
In the U.S. we file federal and state income tax returns where statutes of limitations generally range from three to five years. Although we have resolved examinations with the IRS through tax year ended March 31, 2010, U.S. federal tax years are open from 2011 forward due to attribute carryforwards. The statute of limitations is open from fiscal year 2019 forward in certain state jurisdictions. We also file income tax returns in international jurisdictions where statutes of limitations generally range from three to seven years. Years beginning after 2017 are open for examination by certain foreign taxing authorities.
10. Employee Benefit Plans
Defined Contribution Plans
We maintain 401(k) plans for employees located in the United States meeting certain service requirements. Generally, the plans allow eligible employees to contribute a portion of their compensation, and we match
We also maintain defined contribution retirement plans for employees located in the United Kingdom and in the Asia Pacific region in accordance with local statutory requirements and business practices.
Defined Benefit Plan
We maintain certain defined benefit plans covering eligible employees of our India subsidiary in accordance with local statutory requirements and business practices. The Gratuity Plan provides a lump-sum payment to vested employees at retirement, death, incapacitation, or termination of employment, of an amount based on the respective employee’s salary and the tenure of employment with the Company. The Leave Encashment Plan provides a lump-sum payment to employees when they leave the Company based on a multiple of their final monthly salary. Both the Gratuity and Leave Encashment Plans are unfunded with obligation amounts determined by actuarial valuations. These obligation amounts are recorded in the Consolidated Balance Sheets as “Employee benefit obligations” within “Other non-current liabilities”. All expenses associated with these plans are recorded in the Consolidated Statements of Operations within “Operating expenses”.
Employer benefit obligations as of and related changes for the years ended March 31 are as follows:
(In thousands) |
|
|
2024 |
|
|
|
2023 |
|
|
|
2022 |
|
Employee benefit obligations as of April 1 |
|
$ |
|
|
$ |
|
|
$ |
|
|||
Employee benefits paid |
|
|
( |
) |
|
|
( |
) |
|
|
( |
) |
Employer expenses |
|
|
|
|
|
|
|
|
|
|||
Employee benefit obligations |
|
$ |
|
|
$ |
|
|
$ |
|
59
Endorsement Split-Dollar Life Insurance
Agilysys provides certain former executives with life insurance benefits through endorsement split-dollar life insurance arrangements. We entered into agreements with each of the former executives, whereby we must maintain the life insurance policy for a specified amount and split a portion of the policy benefits with their designated beneficiary.
Our investment in these corporate-owned life insurance policies were recorded at their cash surrender value, which approximates fair value at the balance sheet date. In the Consolidated Balance Sheets as of March 31, 2024 and 2023, the cash surrender value of $
Changes in the cash surrender value of these policies related to gains and losses incurred on these investments are classified within “Other (expense) income, net” in the accompanying Consolidated Statements of Operations and are immaterial.
11. Commitments and Contingencies
Legal Contingencies
We are involved in legal actions that arise in the ordinary course of business. It is the opinion of management that the resolution of any current pending litigation will not have a material adverse effect on our financial position or results of operations.
12. Earnings per Share
The following data shows the amounts used in computing earnings per share and the effect on earnings and the weighted average number of shares of dilutive potential common shares.
|
Year Ended March 31, |
|
|||||||||
(In thousands, except per share data) |
2024 |
|
|
2023 |
|
|
2022 |
|
|||
Numerator: |
|
|
|
|
|
|
|
|
|||
Net income |
$ |
|
|
$ |
|
|
$ |
|
|||
Series A convertible preferred stock dividends |
|
( |
) |
|
|
( |
) |
|
|
( |
) |
Net income attributable to common shareholders |
$ |
|
|
$ |
|
|
$ |
|
|||
|
|
|
|
|
|
|
|
|
|||
Denominator: |
|
|
|
|
|
|
|
|
|||
Weighted average shares outstanding - basic |
|
|
|
|
|
|
|
|
|||
Dilutive SSARs |
|
|
|
|
|
|
|
|
|||
Dilutive RSUs |
|
|
|
|
|
|
|
|
|||
Dilutive unvested restricted shares |
|
|
|
|
|
|
|
|
|||
Weighted average shares outstanding - diluted |
|
|
|
|
|
|
|
|
|||
|
|
|
|
|
|
|
|
|
|||
Income per share - basic: |
$ |
|
|
$ |
|
|
$ |
|
|||
Income per share - diluted: |
$ |
|
|
$ |
|
|
$ |
|
|||
|
|
|
|
|
|
|
|
|
|||
Anti-dilutive SSARs, restricted shares, restricted stock units, |
|
|
|
|
|
|
|
|
|||
Basic income per share is computed as net income available to common shareholders divided by the weighted average basic shares outstanding. The outstanding shares used to calculate the weighted average basic shares excludes
Diluted income per share includes the effect of all potentially dilutive securities on earnings per share. We have stock-settled appreciation rights (SSARs), unvested restricted shares, restricted stock units, employee stock purchase plan (ESPP) shares, and performance shares, that are potentially dilutive securities. When a loss is reported, the denominator of diluted earnings per share cannot be adjusted for the dilutive impact of share-based compensation awards because doing so would be anti-dilutive.
60
13. Share-based Compensation
We may grant incentive stock options, non-qualified stock options, SSARs, restricted shares, restricted stock units, and performance shares under our shareholder-approved 2020 Stock Incentive Plan (the 2020 Plan) for up to
We may distribute authorized but unissued shares or treasury shares to satisfy share option and SSAR exercises or grants of restricted shares, restricted stock units, performance shares, or ESPP shares.
For SSARs, the exercise price must be set at least equal to the closing market price of our common shares on the date of grant. The maximum term of SSARs is seven years from the date of grant. The Compensation Committee of the Board of Directors establishes the period over which SSARs subject to a service condition vest and the vesting criteria for SSARs subject to a market condition.
Restricted shares and restricted stock units, whether time-vested or performance-based, may be issued at no cost or at a purchase price that may be below their fair market value, but are subject to forfeiture and restrictions on their sale or other transfer. Performance-based grants may be conditioned upon the attainment of specified performance objectives and other conditions, restrictions, and contingencies. Restricted shares have the right to receive dividends, if any, upon vesting, subject to the same forfeiture provisions that apply to the underlying grants.
We record compensation expense related to SSARs, restricted shares, restricted stock units, performance shares, and ESPP shares granted to certain employees and non-employee directors based on the fair value of the awards on the grant date. The fair value of restricted stock unit and restricted share grants subject only to a service condition is based on the closing price of our common shares on the grant date. For stock option and SSAR grants subject only to a service condition, we estimate the fair value on the grant date using the Black-Scholes-Merton option pricing model with inputs including the closing market price at grant date, exercise price and assumptions regarding the risk-free interest rate, expected volatility of our common shares based on historical volatility, and expected term as estimated using the simplified method. We use the simplified method for SSAR grants because we believe historical exercise data does not provide a reasonable basis upon which to estimate the expected term. For restricted stock unit, restricted share, and SSAR grants subject to a market condition, we estimate the fair value on the grant date through a lattice option pricing model that utilizes a Monte Carlo analysis with inputs including the closing market price at grant date, share price threshold, performance period term and assumptions regarding the risk-free interest rate and expected volatility of our common shares based on historical volatility. Inputs for SSAR grants subject to a market condition also include exercise price, remaining contractual term, and suboptimal exercise factor.
We record compensation expense for restricted stock units, restricted shares, and SSAR grants subject to a service condition using the graded vesting method. We record compensation expense for ESPP shares on a straight-line basis over the applicable offering period. We record compensation expense for SSAR grants subject only to a market condition over the derived service period, which is an output of the lattice option pricing model. Under the 2020 Plan, the fair value of performance shares is based on the closing price of our common shares on the settlement date of the performance award, for which we record compensation expense over the service period consistent with our annual bonus incentive plan as approved by the Compensation Committee of the Board of Directors.
The following table summarizes the share-based compensation expense for SSARs, restricted shares, restricted stock units, performance shares, and ESPP shares included in the Consolidated Statements of Operations for fiscal 2024, 2023 and 2022:
|
|
Year Ended March 31, |
|
|||||||||
(In thousands) |
|
2024 |
|
|
2023 |
|
|
2022 |
|
|||
Product development |
|
$ |
|
|
$ |
|
|
$ |
|
|||
Sales and marketing |
|
|
|
|
|
|
|
|
|
|||
General and administrative |
|
|
|
|
|
|
|
|
|
|||
Total share-based compensation expense |
|
$ |
|
|
$ |
|
|
$ |
|
|||
Stock-Settled Stock Appreciation Rights
SSARs are rights granted to an employee to receive value equal to the difference between the price of our common shares on the date of exercise and the exercise price. The value is settled in common shares of Agilysys, Inc.
61
We use a Black-Scholes-Merton option pricing model to estimate the fair value of service condition SSARs and a lattice option pricing model to estimate the fair value of market condition SSARs. There were no SSARs granted in fiscal 2024, 2023 or 2022.
The following table summarizes the activity during fiscal 2024 for SSARs awarded under the 2020 and 2016 Plans:
(In thousands, except share and per share data) |
|
Number |
|
|
Weighted- |
|
|
Remaining |
|
|
Aggregate |
|
||||
|
|
|
|
|
(per right) |
|
|
(in years) |
|
|
|
|
||||
Outstanding at April 1, 2023 |
|
|
|
|
$ |
|
|
|
|
|
|
|
||||
Granted |
|
|
|
|
|
|
|
|
|
|
|
|
||||
Exercised |
|
|
( |
) |
|
|
|
|
|
|
|
|
|
|||
Forfeited |
|
|
|
|
|
|
|
|
|
|
|
|
||||
Cancelled/expired |
|
|
|
|
|
|
|
|
|
|
|
|
||||
Outstanding at March 31, 2024 |
|
|
|
|
$ |
|
|
|
|
|
$ |
|
||||
Exercisable at March 31, 2024 |
|
|
|
|
$ |
|
|
|
|
|
$ |
|
||||
Vested and expected to vest at March 31, 2024 |
|
|
|
|
$ |
|
|
|
|
|
$ |
|
||||
The following table presents additional information related to SSARs activity during fiscal 2024, 2023 and 2022:
(In thousands) |
|
2024 |
|
|
2023 |
|
|
2022 |
|
|||
Compensation expense |
|
$ |
|
|
$ |
|
|
$ |
|
|||
Total intrinsic value of SSARs exercised |
|
$ |
|
|
$ |
|
|
$ |
|
|||
Total fair value of SSARs vesting |
|
$ |
|
|
$ |
|
|
$ |
|
|||
As of March 31, 2024, there was
A total of
Restricted Shares
We use a lattice option pricing model to estimate the fair value of restricted shares subject to a market condition. There were no restricted shares subject to a market condition granted in fiscal 2024 or 2023. The following table summarizes the principal valuation assumptions utilized and the resulting fair value of restricted shares subject to a market condition granted in fiscal 2022:
|
|
2022 |
Risk-free interest rate over contractual term |
|
|
Expected volatility |
|
|
Weighted-average grant date fair value |
|
$ |
62
We granted restricted shares to certain of our Directors, executives and key employees, the vesting of which is service-based. Certain restricted shares are also subject to a market condition.
|
|
Number |
|
|
Weighted- |
|
||
|
|
|
|
|
(per share) |
|
||
Outstanding at April 1, 2023 |
|
|
|
|
$ |
|
||
Granted |
|
|
|
|
|
|
||
Vested |
|
|
( |
) |
|
|
|
|
Forfeited |
|
|
( |
) |
|
|
|
|
Outstanding at March 31, 2024 |
|
|
|
|
$ |
|
||
The weighted-average grant date fair value of the restricted shares includes grants subject only to a service condition and certain grants subject to both a service condition and a market condition. As of March 31, 2024, a total of
The following table presents additional information related to restricted share activity during fiscal years 2024, 2023, and 2022:
(In thousands) |
|
2024 |
|
|
2023 |
|
|
2022 |
|
|||
Compensation expense |
|
$ |
|
|
$ |
|
|
$ |
|
|||
Total fair value of restricted share vesting |
|
$ |
|
|
$ |
|
|
$ |
|
|||
As of March 31, 2024, total unrecognized share-based compensation expense related to non-vested restricted shares was $
Restricted Stock Units
We granted restricted stock units to our Chief Executive Officer, the vesting of which is service-based. Certain restricted stock units are also subject to a market condition.
|
|
Number |
|
|
Weighted- |
|
||
|
|
|
|
|
(per share) |
|
||
Outstanding at April 1, 2023 |
|
|
|
|
$ |
|
||
Granted |
|
|
|
|
|
|
||
Vested |
|
|
( |
) |
|
|
|
|
Forfeited |
|
|
|
|
|
|
||
Outstanding at March 31, 2024 |
|
|
|
|
$ |
|
||
We use a lattice option pricing model to estimate the fair value of restricted stock units subject to a market condition. There were no restricted stock units subject to a market condition granted in fiscal 2024 or 2022.
|
|
2023 |
|
|
Risk-free interest rate over contractual term |
|
|
% |
|
Expected volatility |
|
|
% |
|
Weighted-average grant date fair value |
|
$ |
|
|
63
The following table presents additional information related to restricted stock unit activity during fiscal 2024:
(In thousands) |
|
2024 |
|
|
Compensation expense |
|
$ |
|
|
Total fair value of restricted stock unit vesting |
|
$ |
|
|
As of March 31, 2024, total unrecognized share-based compensation expense related to non-vested restricted stock units was $
Performance Shares
Upon approval of the Compensation Committee of our Board of Directors, after achieving the performance conditions associated with our annual bonus plan, we grant common shares to our Chief Executive Officer that vest immediately. Once attainment of the performance conditions becomes probable, we recognize compensation expense related to performance shares ratably over the performance period. The number of performance shares granted will be based on the closing price of our common shares on the grant date and settlement date, which are the same under the 2020 plan.
Based on the performance conditions achieved as they relate to our annual bonus plan, management estimates a liability of $
Employee Stock Purchase Plan Shares
The ESPP permits participants to purchase common stock through regular payroll deductions, up to a specified percentage of their eligible compensation. The ESPP is compensatory because, among other provisions, it currently allows participants to purchase stock at up to a
|
|
Offering Period Ending |
|
|
|
|
June 30, 2024 |
|
|
Grant date fair value |
|
$ |
|
|
Risk-free interest rate over contractual term |
|
|
% |
|
Expected term (in years) |
|
|
|
|
Expected volatility |
|
|
% |
|
The risk-free interest rate is based on the yield of a zero coupon U.S. Treasury bond whose maturity period approximates the expected term of the ESPP shares. The expected term is the offering period, which is typically six months.
We record amounts withheld from participants during each offering period in accrued salaries, wages and related benefits in the consolidated balance sheets until such shares are purchased. Amounts withheld from participants for the offering period ending June 30, 2024 totaled $
As of March 31, 2024, total unrecognized share-based compensation expense related to ESPP shares was $
64
14. Preferred Stock
Series A Convertible Preferred Stock
On May 22, 2020, we completed the sale of
Conversion
On November 24, 2023, at our option, we required conversion of all the outstanding shares of Convertible Preferred Stock to common stock. On November 27, 2023, we filed a Certificate of Elimination with the Secretary of State of the State of Delaware with respect to the Convertible Preferred Stock pursuant to which the Convertible Preferred Stock was eliminated and returned to the status of authorized and unissued preferred shares of the Company. Following the mandatory conversion of the outstanding shares of the Convertible Preferred Stock on November 24, 2023, there were no outstanding shares of the Convertible Preferred Stock. Accordingly, we removed the Series A convertible preferred stock,
Dividends
Prior to the conversion on November 24, 2023,
Accounting Policy
Prior to the conversion on November 24, 2023, we classified convertible preferred stock as temporary equity in the consolidated balance sheets due to certain contingent redemption clauses that were at the election of the Holders. We increased the carrying value of the convertible preferred stock to its redemption value for all undeclared dividends using the interest method.
65
15. Business Combination
On
The purchase price consisted of $
In accordance with Accounting Standards Update (ASU) No. 2021-08, we applied Accounting Standards Codification Topic 606 to record certain customer accounts receivable and the contract liabilities assumed in the acquisition, which consisted of undelivered performance obligations under customer contracts. We adopted ASU 2021-08 early as permitted. As a result, in allocating the purchase price, we recorded $
(In thousands) |
|
Total |
|
|
Components of Purchase Price: |
|
|
|
|
Cash |
|
$ |
|
|
Total purchase price |
|
$ |
|
|
Allocation of Purchase Price: |
|
|
|
|
Net tangible assets (liabilities): |
|
|
|
|
Accounts receivable, net |
|
$ |
|
|
Other current assets, including cash acquired |
|
|
|
|
Other assets |
|
|
|
|
Current and other liabilities |
|
|
( |
) |
Contract liabilities |
|
|
( |
) |
Deferred income taxes, non-current |
|
|
( |
) |
Net tangible assets (liabilities) |
|
|
( |
) |
Identifiable intangible assets: |
|
|
|
|
Customer relationships |
|
|
|
|
Non-competition agreements |
|
|
|
|
Developed technology |
|
|
|
|
Trade names |
|
|
|
|
Total identifiable intangible assets |
|
|
|
|
Goodwill |
|
|
|
|
Total purchase price allocation |
|
$ |
|
|
We assigned the acquired customer relationships, non-competition agreements, developed technology, and trade names estimated useful lives of
The goodwill recognized in the ResortSuite purchase price allocation is attributable to synergies in products and technologies to serve a broader customer base, and the addition of a skilled, assembled workforce. During the year ended March 31, 2023, we increased goodwill by $
The Company recognized acquisition costs of $
66
Revenue attributable to ResortSuite included in our consolidated statement of operations was $
Effective April 1, 2022, ResortSuite became Agilysys Canada, Inc. a wholly-owned subsidiary of Agilysys, Inc.
16. Subsequent Events
None.
17. Related Party Transaction
See Note 14. Preferred Stock, for description of the MAK Capital investment in the Company. Michael Kaufman, the Chairman of the Company’s Board of Directors, is the Chief Executive Officer of MAK Capital.
Schedule II - Valuation and Qualifying Accounts Years ended March 31, 2024, 2023 and 2022
(In thousands) |
|
Balance at |
|
|
Charged to |
|
|
Deductions |
|
|
Balance at |
|
||||
2024 |
|
|
|
|
|
|
|
|
|
|
|
|
||||
Deferred tax valuation allowance |
|
$ |
|
|
$ |
|
|
$ |
( |
) |
|
$ |
|
|||
Allowance for expected credit losses |
|
$ |
|
|
$ |
|
|
$ |
( |
) |
|
$ |
|
|||
2023 |
|
|
|
|
|
|
|
|
|
|
|
|
||||
Deferred tax valuation allowance |
|
$ |
|
|
$ |
|
|
$ |
( |
) |
|
$ |
|
|||
Allowance for doubtful accounts |
|
$ |
|
|
$ |
|
|
$ |
( |
) |
|
$ |
|
|||
2022 |
|
|
|
|
|
|
|
|
|
|
|
|
||||
Deferred tax valuation allowance |
|
$ |
|
|
$ |
|
|
$ |
( |
) |
|
$ |
|
|||
Allowance for doubtful accounts |
|
$ |
|
|
$ |
|
|
$ |
( |
) |
|
$ |
|
|||
67
Item 9. Change in and Disagreements With Accountants on Accounting and Financial Disclosures.
None.
Item 9A. Controls and Procedures.
Evaluation of Disclosure Controls and Procedures
Our management, with the participation of our Chief Executive Officer (“CEO”), Chief Financial Officer (“CFO”) and Corporate Controller and Treasurer, as Principal Accounting Officer (“PAO”), evaluated the effectiveness of our disclosure controls and procedures as of the end of the period covered by this report. Based on that evaluation, the CEO, CFO, and PAO concluded that our disclosure controls and procedures as of the end of the period covered by this report are effective to ensure that information required to be disclosed by us in reports filed under the Exchange Act of 1934 is (i) recorded, processed, summarized, and reported within the time periods specified in the SEC's rules and forms and (ii) is accumulated and communicated to our management, including the CEO, CFO, and PAO, as appropriate to allow for timely decisions regarding required disclosure.
Management's Report on Internal Control Over Financial Reporting
The management of Agilysys, under the supervision of the CEO, CFO, and PAO, is responsible for establishing and maintaining adequate internal control over financial reporting, as such term is defined in Exchange Act Rules 13a-15(f) and 15d-15(f). Under the supervision of our CEO, CFO, and PAO, management conducted an evaluation of the effectiveness of our internal control over financial reporting as of March 31, 2024 based on the framework in Internal Control - Integrated Framework (2013) issued by the Committee of Sponsoring Organizations of the Treadway Commission (“COSO”). Based on the evaluation, management concluded that Agilysys maintained effective internal control over financial reporting as of March 31, 2024.
Grant Thornton LLP, our independent registered public accounting firm, issued their report regarding Agilysys' internal control over financial reporting as of March 31, 2024, which is included elsewhere in this annual report.
Change in Internal Control over Financial Reporting
No changes in our internal control over financial reporting occurred during the last quarter of fiscal 2024 that has materially affected, or is reasonably likely to materially affect, our internal control over financial reporting.
Inherent Limitations on Effectiveness of Controls
Our management, including our CEO, CFO, and PAO, does not expect that our disclosure controls or our internal control over financial reporting will prevent or detect all errors and all fraud. A control system, no matter how well conceived and operated, can provide only reasonable, not absolute, assurance that the objectives of the control system will be achieved. Further, the design of a control system must reflect the impact of resource constraints, and the benefits of controls must be considered relative to their costs. Because of the inherent limitations in all control systems, no evaluation of controls can provide absolute assurance that all control issues and instances of fraud, if any, have been detected. These inherent limitations include the possibility that judgments in decision-making can be faulty, and that breakdowns can occur because of simple errors. Additionally, controls can be circumvented by individual acts, by collusion of two or more people, or by management override of the controls. The design of any system of controls also is based in part upon certain assumptions about the likelihood of future events, and there can be no assurance that any design will succeed in achieving its stated goals under all possible conditions. Over time, controls may become inadequate because of changes in conditions or deterioration in the degree of compliance with policies or procedures. Because of the inherent limitations in a cost-effective control system, misstatements due to error or fraud may occur and not be detected.
Item 9B. Other Information
Rule 10b5-1 Trading Plans
On
68
Also on
Item 9C. Disclosure Regarding Foreign Jurisdictions that Prevent Inspections
Not applicable.
69
Part III
Item 10. Directors, Executive Officers and Corporate Governance.
Information required by this Item as to the Directors of Agilysys, Executive Officers, the Audit Committee, Agilysys' Code of Business Conduct, Agilysys' Insider Trading Policy, and the procedures by which shareholders may recommend nominations appearing under the headings “Election of Directors,” “Executive Officers” and “Corporate Governance” in our Proxy Statement to be used in connection with Agilysys' 2024 Annual Meeting of Shareholders (the “2024 Proxy Statement”) is incorporated herein by reference. Information with respect to compliance with Section 16(a) of the Securities Exchange Act of 1934 by our Directors, executive officers, and holders of more than five percent of Agilysys' equity securities will be set forth in the 2024 Proxy Statement under the heading “Section 16(a) Beneficial Ownership Reporting Compliance.”
We adopted a Code of Business Conduct that applies to all Directors and employees of Agilysys, including the Chief Executive Officer and Chief Financial Officer. The Code is available on our website at http://www.agilysys.com.
Item 11. Executive Compensation.
The information required by this Item is set forth in our 2024 Proxy Statement under the headings, “Executive Compensation,” “Director Compensation,” “Compensation Committee Report,” “Corporate Governance,” and “Compensation Discussion and Analysis,” which is incorporated herein by reference.
Item 12. Security Ownership of Certain Beneficial Owners and Management and Related Shareholder Matters.
The information required by this Item is set forth in our 2024 Proxy Statement under the headings “Beneficial Ownership of Common Shares,” and “Equity Compensation Plan Information,” which information is incorporated herein by reference.
The information required by this item is set forth in our 2024 Proxy Statement under the headings “Corporate Governance” and “Related Person Transactions,” which information is incorporated herein by reference.
Item 14. Principal Accountant Fees and Services.
The information required by this Item is set forth in our 2024 Proxy Statement under the heading “Ratification of Appointment of Independent Registered Public Accounting Firm,” which information is incorporated herein by reference.
70
PART IV
Item 15. Exhibits and Financial Statement Schedules.
(a)(1) Financial statements. The following consolidated financial statements are included herein and are incorporated by reference in Part II, Item 8 of this Annual Report:
Report of Grant Thornton LLP, Independent Registered Public Accounting Firm
Consolidated Balance Sheets as of March 31, 2024 and 2023
Consolidated Statements of Operations for the years ended March 31, 2024, 2023, and 2022
Consolidated Statements of Comprehensive Income (Loss) for the years ended March 31, 2024, 2023, and 2022
Consolidated Statements of Cash Flows for the years ended March 31, 2024, 2023, and 2022
Consolidated Statements of Shareholders' Equity for the years ended March 31, 2024, 2023, and 2022
Notes to Consolidated Financial Statements
(a)(2) Financial statement schedule. The following financial statement schedule is included herein and is incorporated by reference in Part II, Item 8 of this Annual Report:
Schedule II - Valuation and Qualifying Accounts
All other schedules have been omitted since they are not applicable or the required information is included in the consolidated financial statements or notes thereto.
(a)(3) Exhibits. Exhibits included herein and those incorporated by reference are listed in the Exhibit Index of this Annual Report.
Item 16. Form 10-K Summary.
None.
71
Agilysys, Inc.
Exhibit Index
|
|
|
|
|
|
Exhibit No. |
|
Description |
|
|
|
2.1 |
|
|
|
|
|
3.1 |
|
|
|
|
|
3.2 |
|
|
|
|
|
3.3 |
|
|
|
|
|
3.4 |
|
|
|
|
|
4 |
|
|
|
|
|
*10.1 |
|
|
|
|
|
*10.2 |
|
|
|
|
|
*10.3 |
|
|
|
|
|
*10.4 |
|
|
|
|
|
*10.5 |
|
|
|
|
|
*10.6 |
|
|
|
|
|
*10.7 |
|
|
|
|
|
*10.8 |
|
|
|
|
|
*10.9 |
|
|
|
|
|
*10.10 |
|
|
|
|
|
*10.11 |
|
|
|
|
|
*10.12 |
|
|
|
|
|
72
*10.13 |
|
|
|
|
|
*10.14 |
|
|
|
|
|
*10.15 |
|
|
|
|
|
*10.16 |
|
|
|
|
|
*10.17 |
|
|
|
|
|
*10.18 |
|
|
|
|
|
*10.19 |
|
|
|
|
|
*10.20 |
|
|
|
|
|
**19 |
|
|
|
|
|
**21 |
|
|
|
|
|
**23.1 |
|
|
|
|
|
**31.1 |
|
Certification of Chief Executive Officer Pursuant to Section 302 of Sarbanes-Oxley Act of 2002. |
|
|
|
**31.2 |
|
Certification of Chief Financial Officer Pursuant to Section 302 of Sarbanes-Oxley Act of 2002. |
|
|
|
**31.3 |
|
|
|
|
|
***32 |
|
|
|
|
|
**97 |
|
|
|
|
|
101.INS |
|
Inline XBRL Instance Document – the instance document does not appear in the Interactive Data File because XBRL tags are embedded within the Inline XBRL document. |
|
|
|
101.SCH |
|
Inline XBRL Taxonomy Extension Schema With Embedded Linkbase Documents |
|
|
|
104 |
|
Cover Page Interactive Data File (embedded within the Inline XBRL document) |
|
|
|
* |
|
Denotes a management contract or compensatory plan or arrangement. |
|
|
|
** |
|
Filed herewith |
|
|
|
*** |
|
The certification attached as Exhibit 32 that accompanies this Annual Report on Form 10-K is not deemed filed with the Securities and Exchange Commission and is not to be incorporated by reference into any filing of Registrant under the Securities Act of 1933, as amended, or the Securities Exchange Act of 1934, as amended, whether made before or after the date of this Annual Report on Form 10-K, irrespective of any general incorporation language contained in such filing. |
73
Signatures
Pursuant to the requirements of Section 13 or 15(d) of the Securities Exchange Act of 1934, the registrant has duly caused this report to be signed on its behalf by the undersigned, thereunto duly authorized, in the City of Alpharetta, State of Georgia, on May 21, 2024.
AGILYSYS, INC. |
||
|
|
|
|
|
/s/ Ramesh Srinivasan |
|
|
Ramesh Srinivasan |
|
|
President, Chief Executive Officer and Director |
Pursuant to the requirements of the Securities Exchange Act of 1934, this report has been signed below by the following persons on behalf of the Registrant and in the capacities indicated on May 21, 2024.
|
||
|
|
|
Signature |
|
Title |
|
|
|
/s/ Ramesh Srinivasan |
|
President, Chief Executive Officer and Director |
Ramesh Srinivasan |
|
(Principal Executive Officer) |
|
|
|
/s/ William David Wood III |
|
Chief Financial Officer, |
William David Wood III |
|
(Principal Financial Officer) |
|
|
|
/s/ Chris J. Robertson |
|
Corporate Controller and Treasurer |
Chris J. Robertson |
|
(Principal Accounting Officer) |
|
|
|
/s/ Michael A. Kaufman |
|
Chairman and Director |
Michael A. Kaufman |
|
|
|
|
|
/s/ Donald A. Colvin |
|
Director |
Donald A. Colvin |
|
|
|
|
|
/s/ Gerald C. Jones |
|
Director |
Gerald C. Jones |
|
|
|
|
|
/s/ John Mutch |
|
Director |
John Mutch |
|
|
|
|
|
/s/ Melvin L. Keating |
|
Director |
Melvin L. Keating |
|
|
|
|
|
/s/ Dana Jones |
|
Director |
Dana Jones |
|
|
74